Product · 2020
Google Data Studio: From Website Traffic to Lead Tracking
A web analytics dashboard case study connecting website traffic, SEO visibility, Google Ads campaigns and lead tracking in one reporting environment.
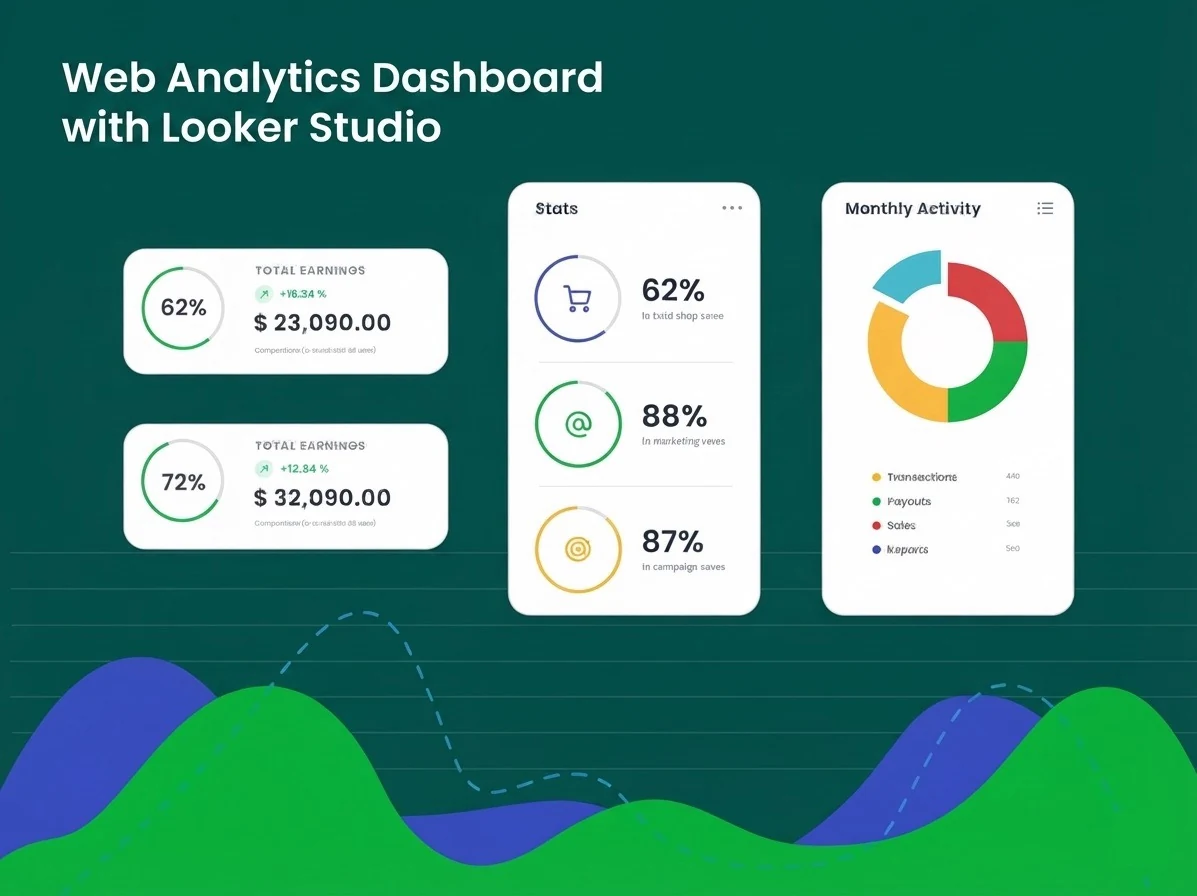
I created a dashboard to bring website traffic, SEO visibility, paid campaigns, and lead tracking into one reporting environment.
The goal was to help the client explore digital performance through clear summaries and detailed views, with filters for location, device, campaign, and website section. All screenshots have been anonymized to protect client confidentiality.
Website Traffic and Audience Analysis
Traffic Overview, Devices, and Acquisition Channels
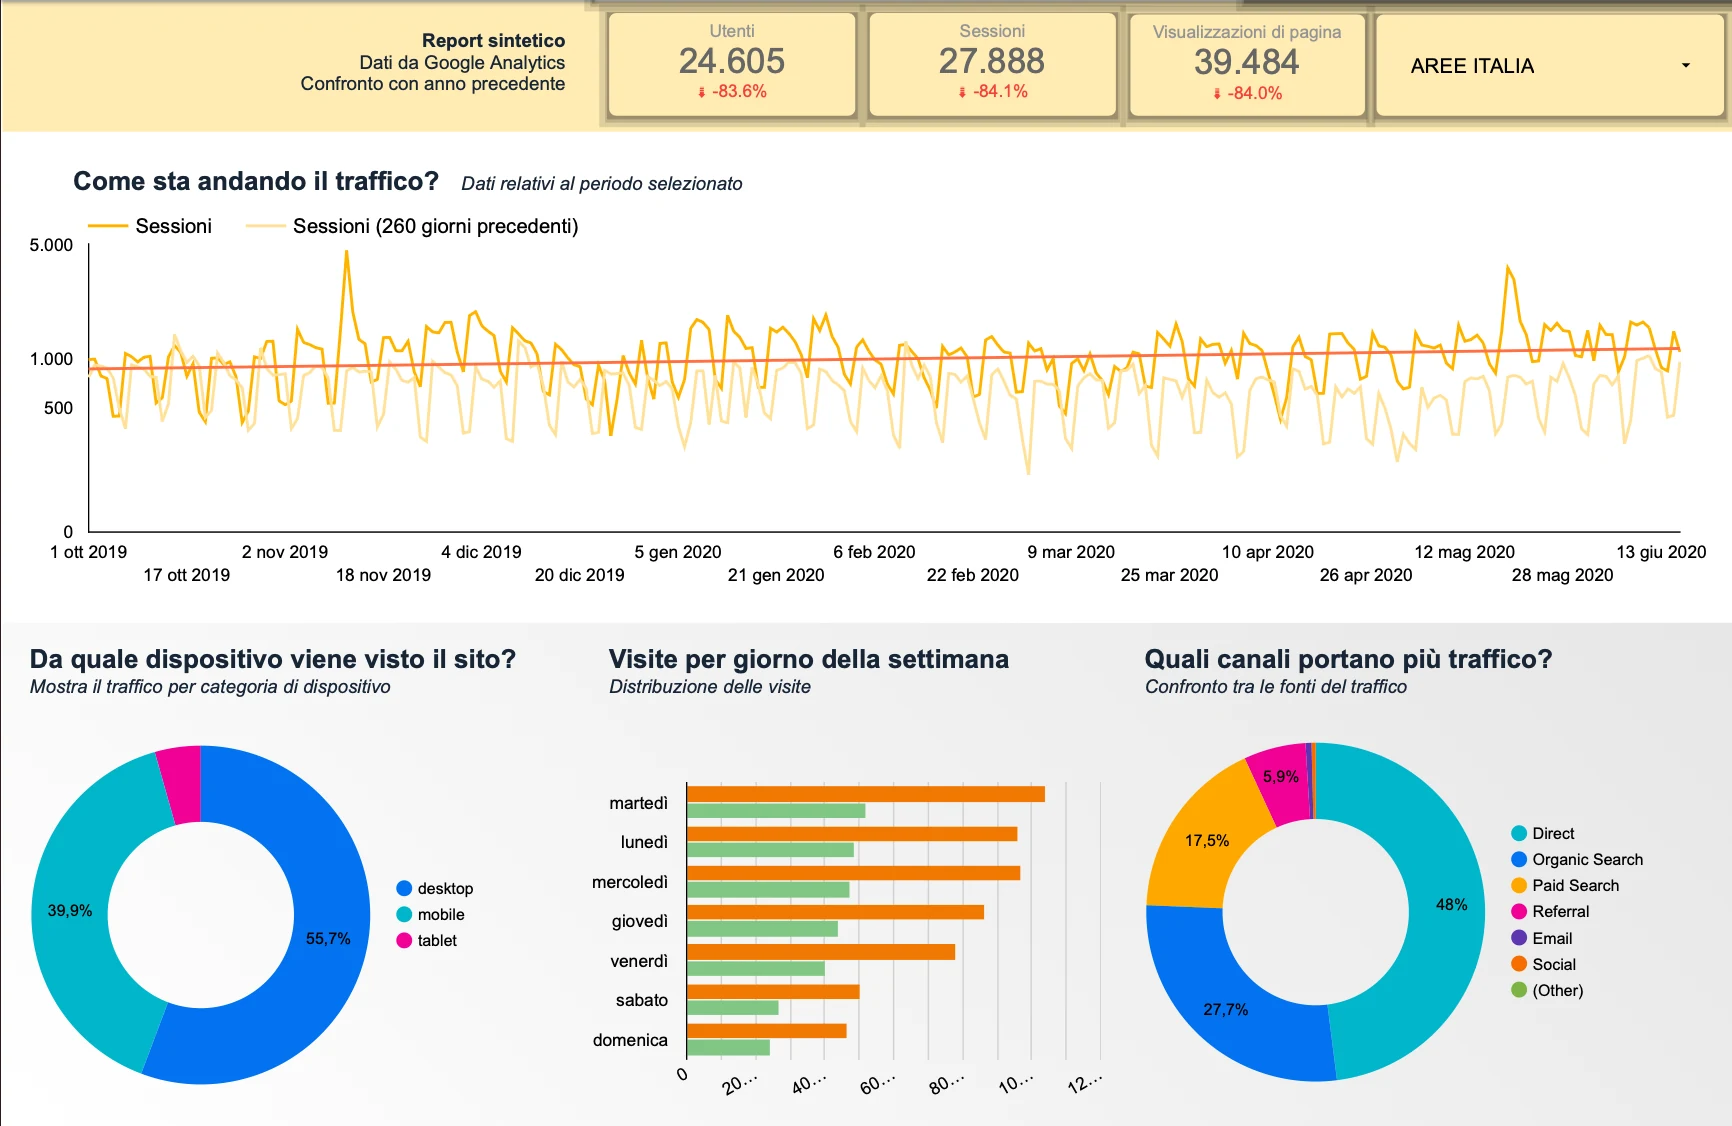
This overview brings together users, sessions, page views, and traffic trends. Device, weekday, and channel breakdowns help the client explore when visitors access the website, which devices they use, and where traffic comes from. In the displayed channel breakdown, Direct accounts for 48%, Organic Search for 27.7%, and Paid Search for 17.5%.
Page Performance and Visitor Geography
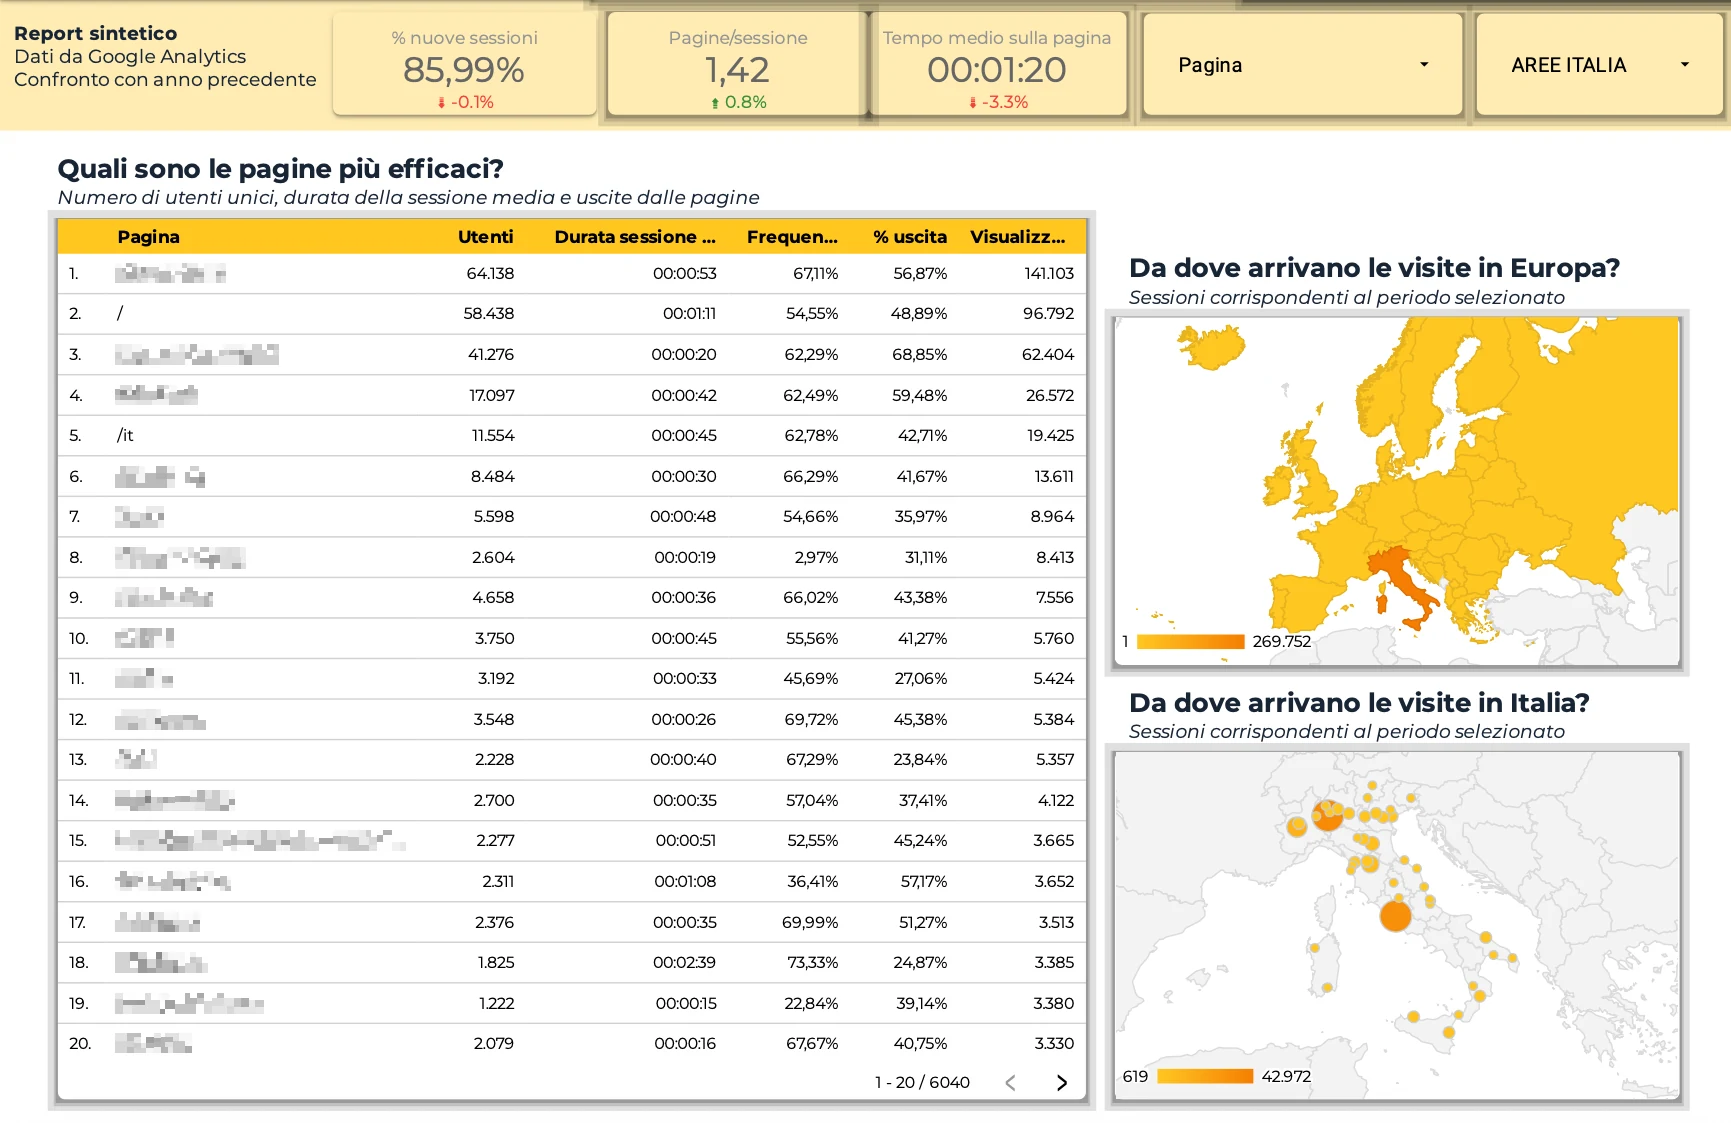
This view combines page-level metrics with maps of visitor locations across Europe and Italy. Users, session duration, exit rate, and page views provide context beyond traffic volume, helping the client compare content consumption and identify pages worth investigating further.
Geographic Traffic and Referral Sources
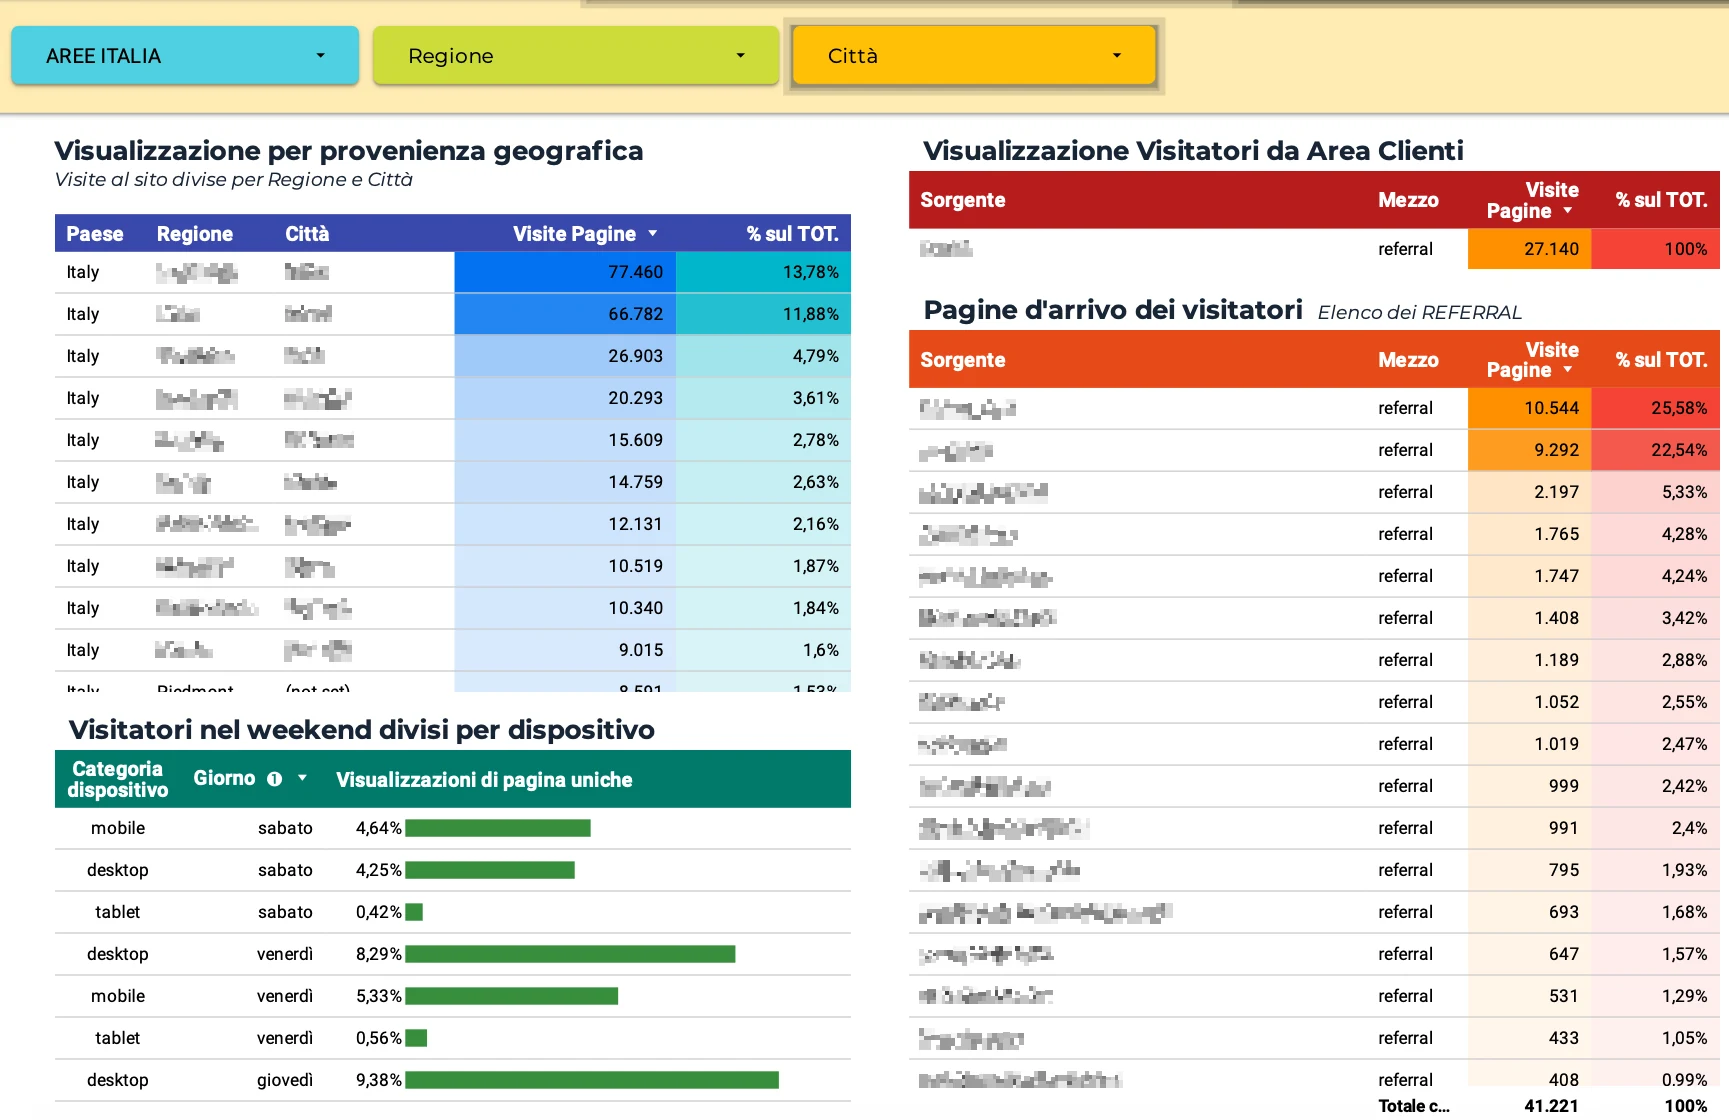
Regional and city filters make it possible to explore geographic differences in website usage. Referral tables highlight traffic associated with external sources and the customer area, while the device-by-day breakdown adds context on browsing patterns. Together, these views support a more detailed understanding of the audience.
SEO Performance and Organic Search Visibility
Google Search Console: Queries, Clicks, and Landing Pages
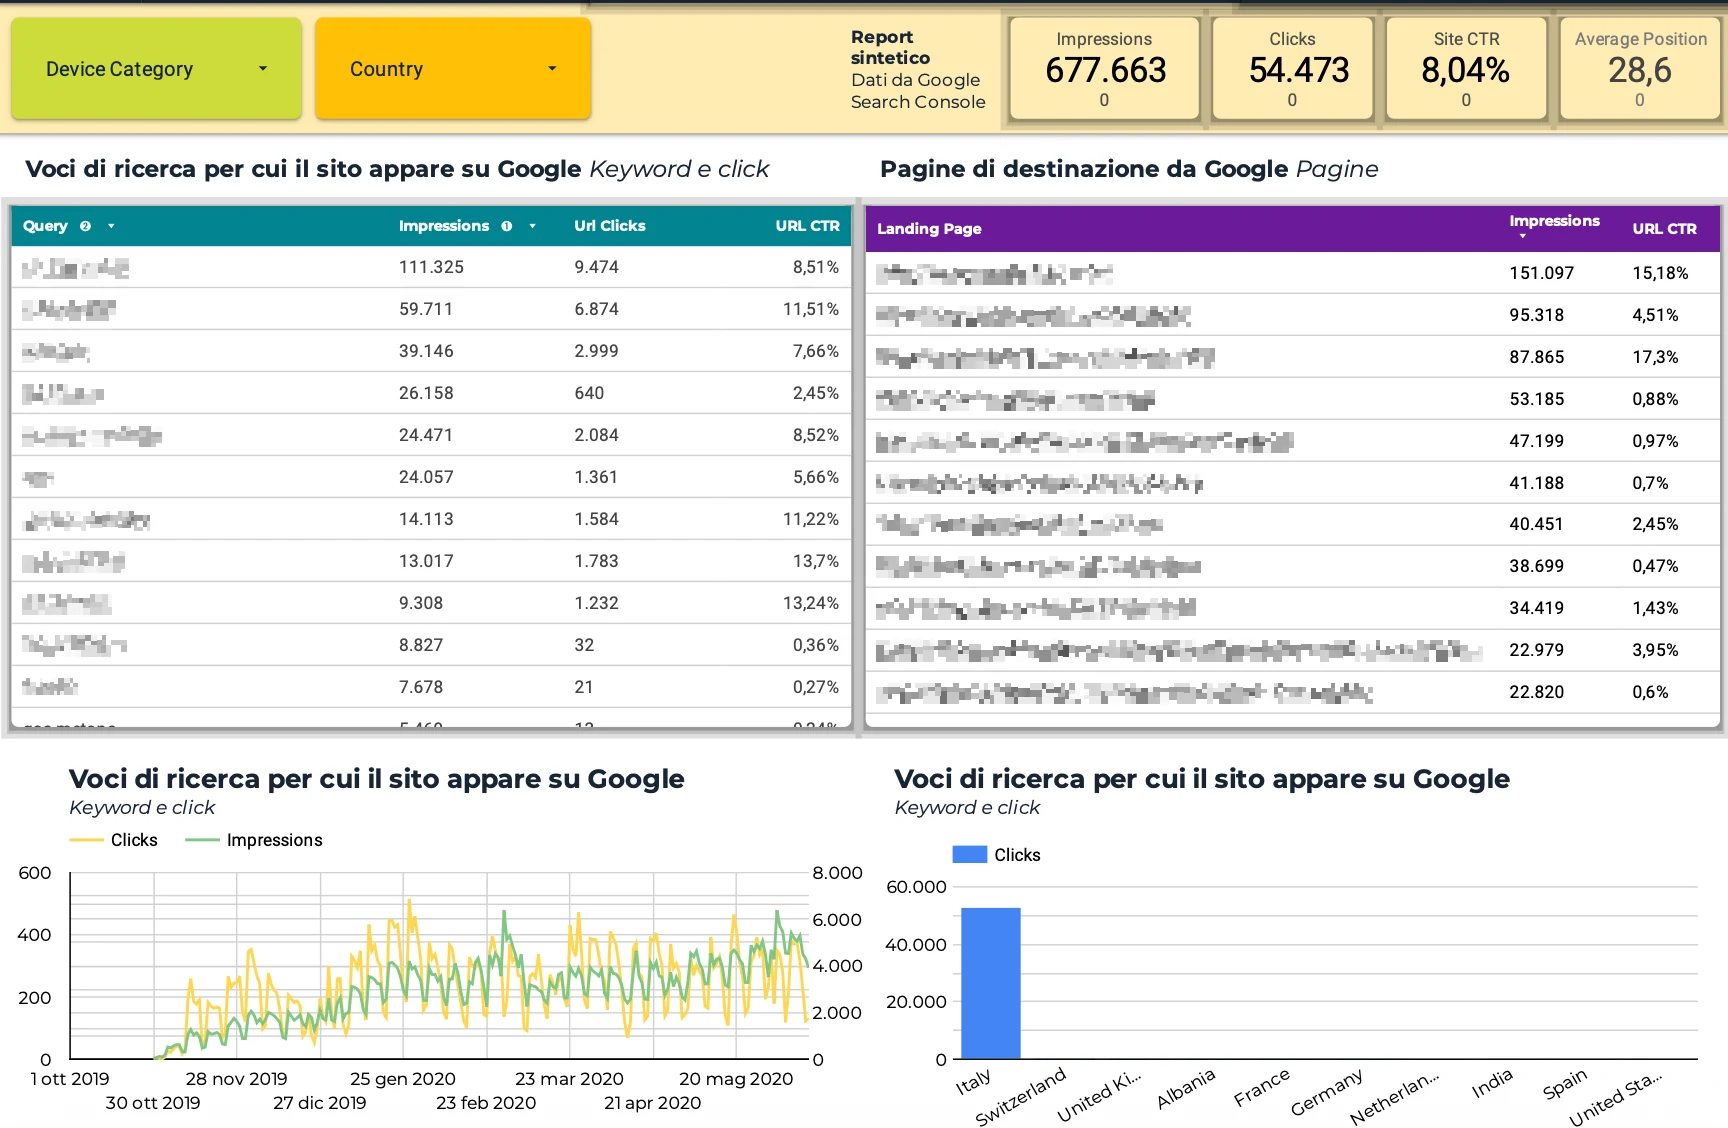
The Search Console view connects search visibility with clicks to the website. It displays 677,663 impressions, 54,473 clicks, and an overall CTR of 8.04%. Query and landing-page tables support deeper analysis, while time-series and country charts show how search performance develops and where clicks originate.
Keyword Rankings and Landing-Page Monitoring
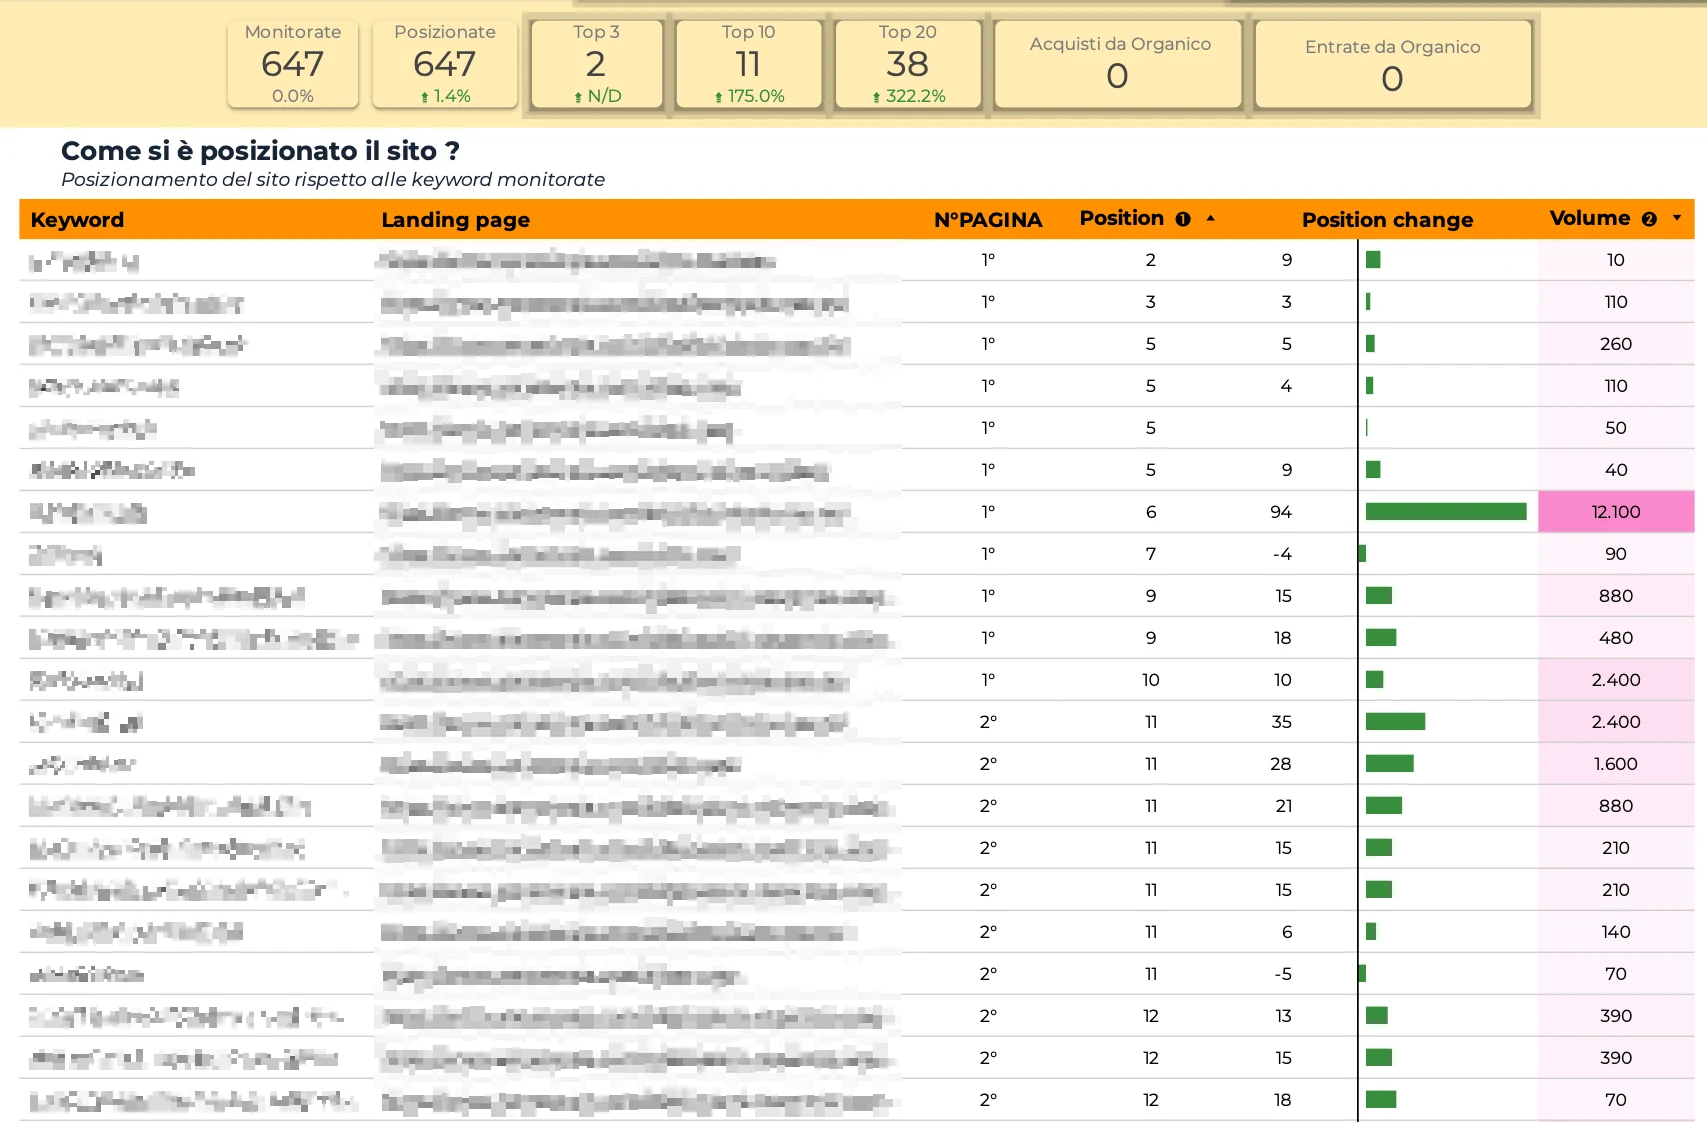
This report links monitored keywords to their landing pages, ranking positions, position changes, and search volumes. Summary cards show 647 tracked keywords, including 11 in the Top 10. The layout makes ranking movements easier to review and helps identify keywords and pages for further SEO analysis.
Organic Visibility and Traffic Trends
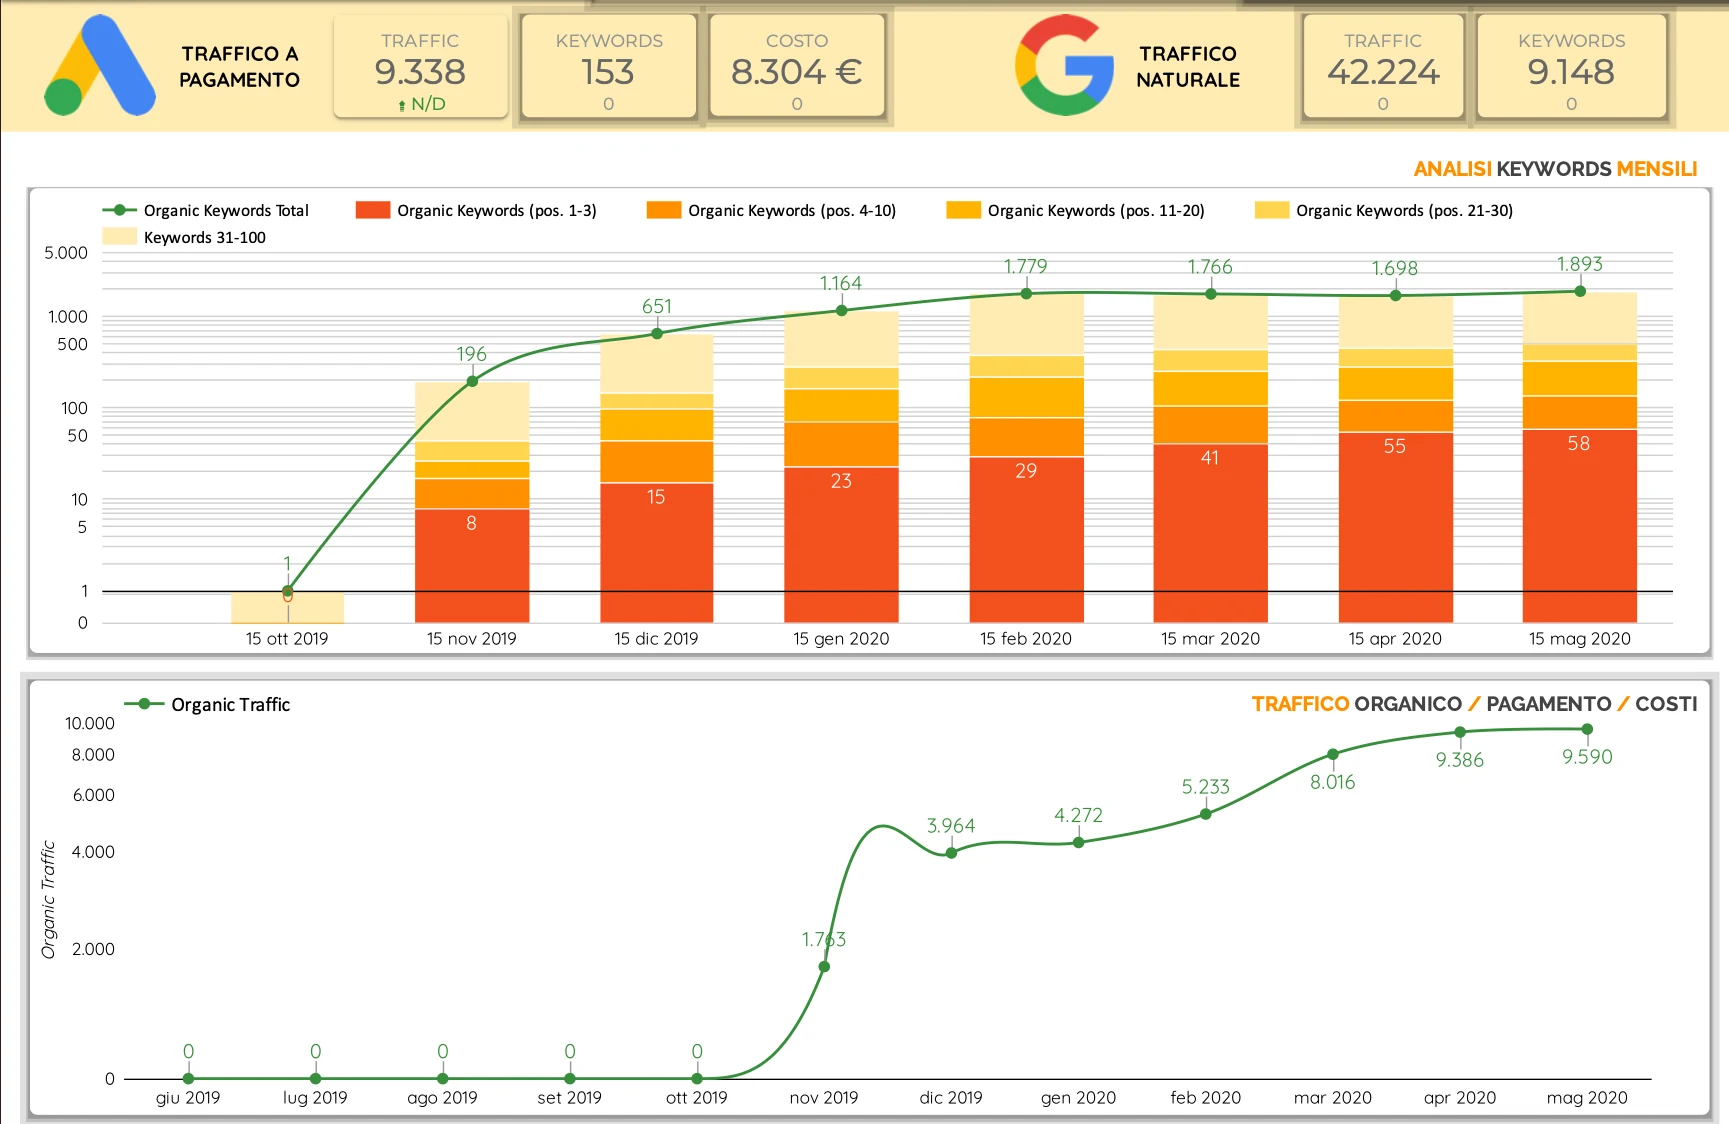
Monthly charts show changes in keyword coverage, ranking distribution, and the reported organic traffic series. Between November 2019 and May 2020, the keyword total rises from 196 to 1,893, while Top 3 keywords increase from 8 to 58. This view documents visibility trends without treating ranking data as equivalent to Analytics sessions.
Google Ads Campaign Reporting
Campaign Costs and Conversions: GPL
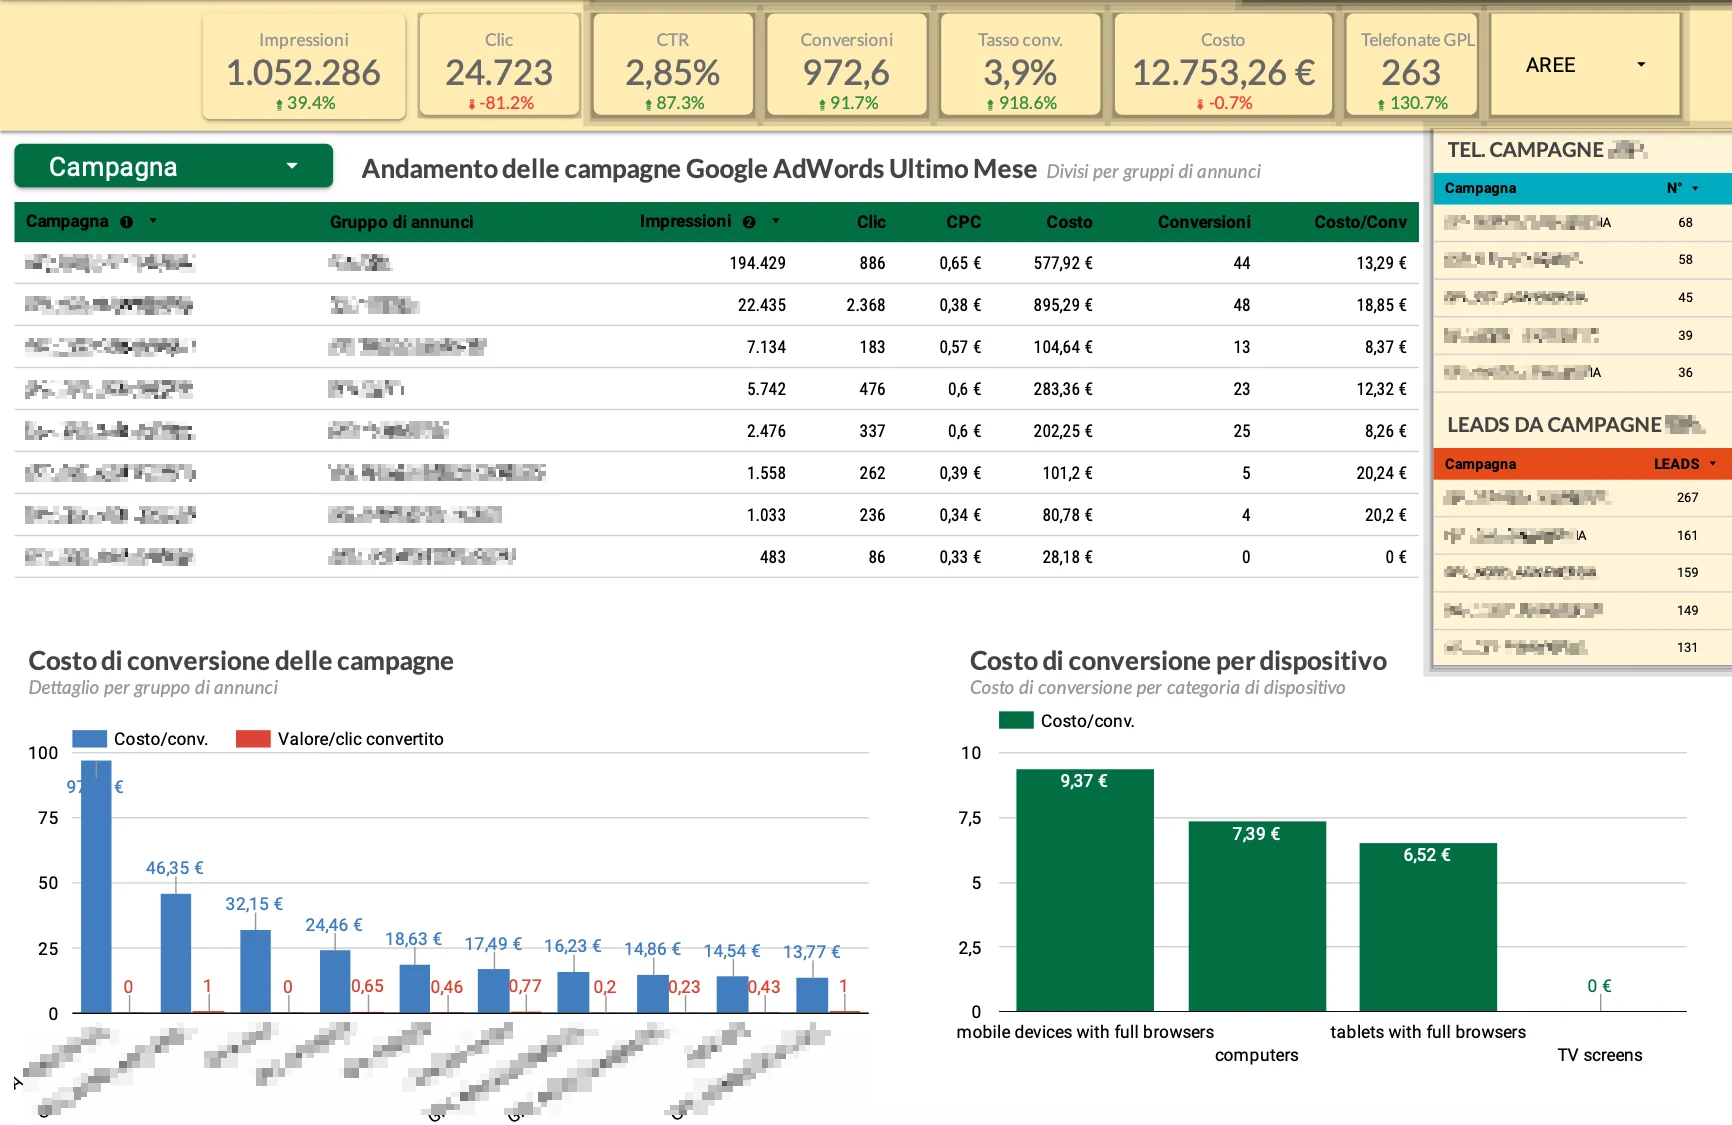
This campaign view brings together impressions, clicks, spend, conversions, and reported phone interactions. Campaign and ad-group tables provide detailed performance data, while charts compare cost per conversion across groups and devices. The layout supports analysis beyond click volume, keeping investment and recorded outcomes visible together.
Campaign Costs and Conversions: Solar
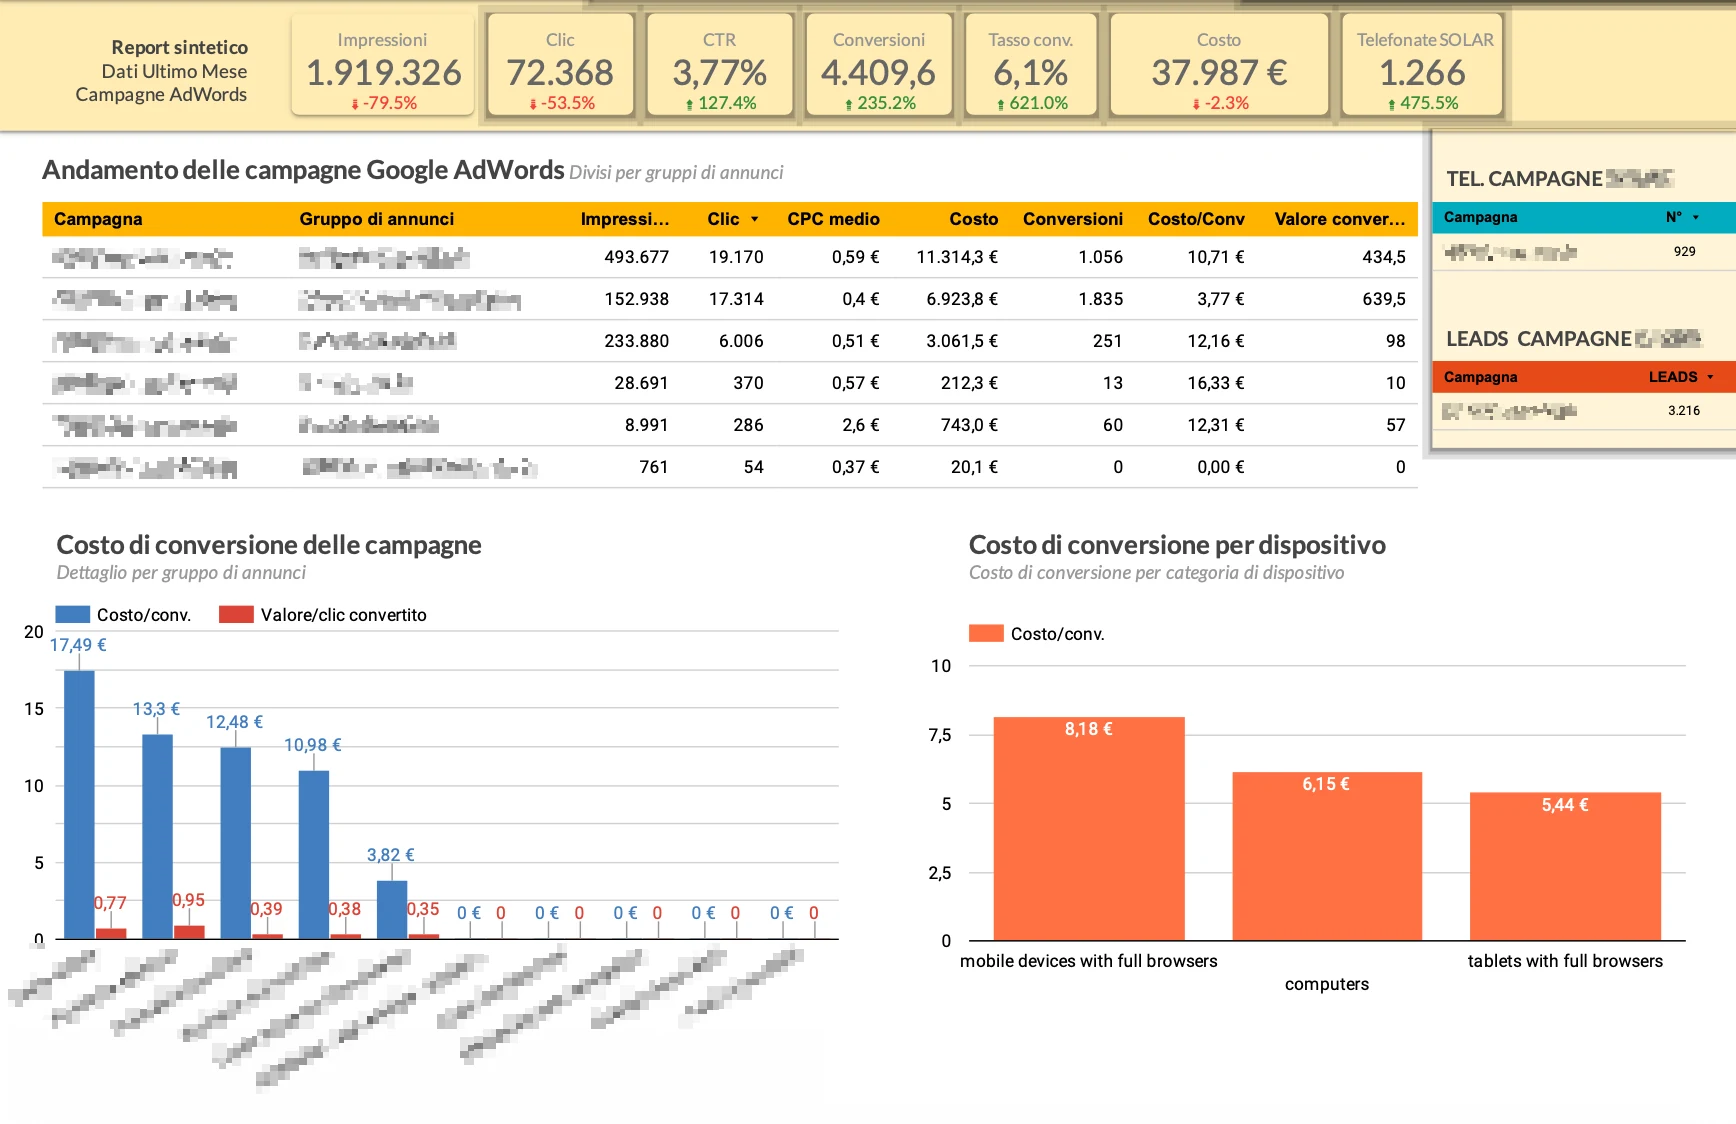
A dedicated view applies the same reporting structure to the Solar campaigns. It combines headline KPIs with ad-group costs, conversion metrics, and device comparisons. Separate panels for reported calls and leads keep these outcomes visible without reducing every interaction to a single total.
Geographic Campaign Analysis: North, East, and West
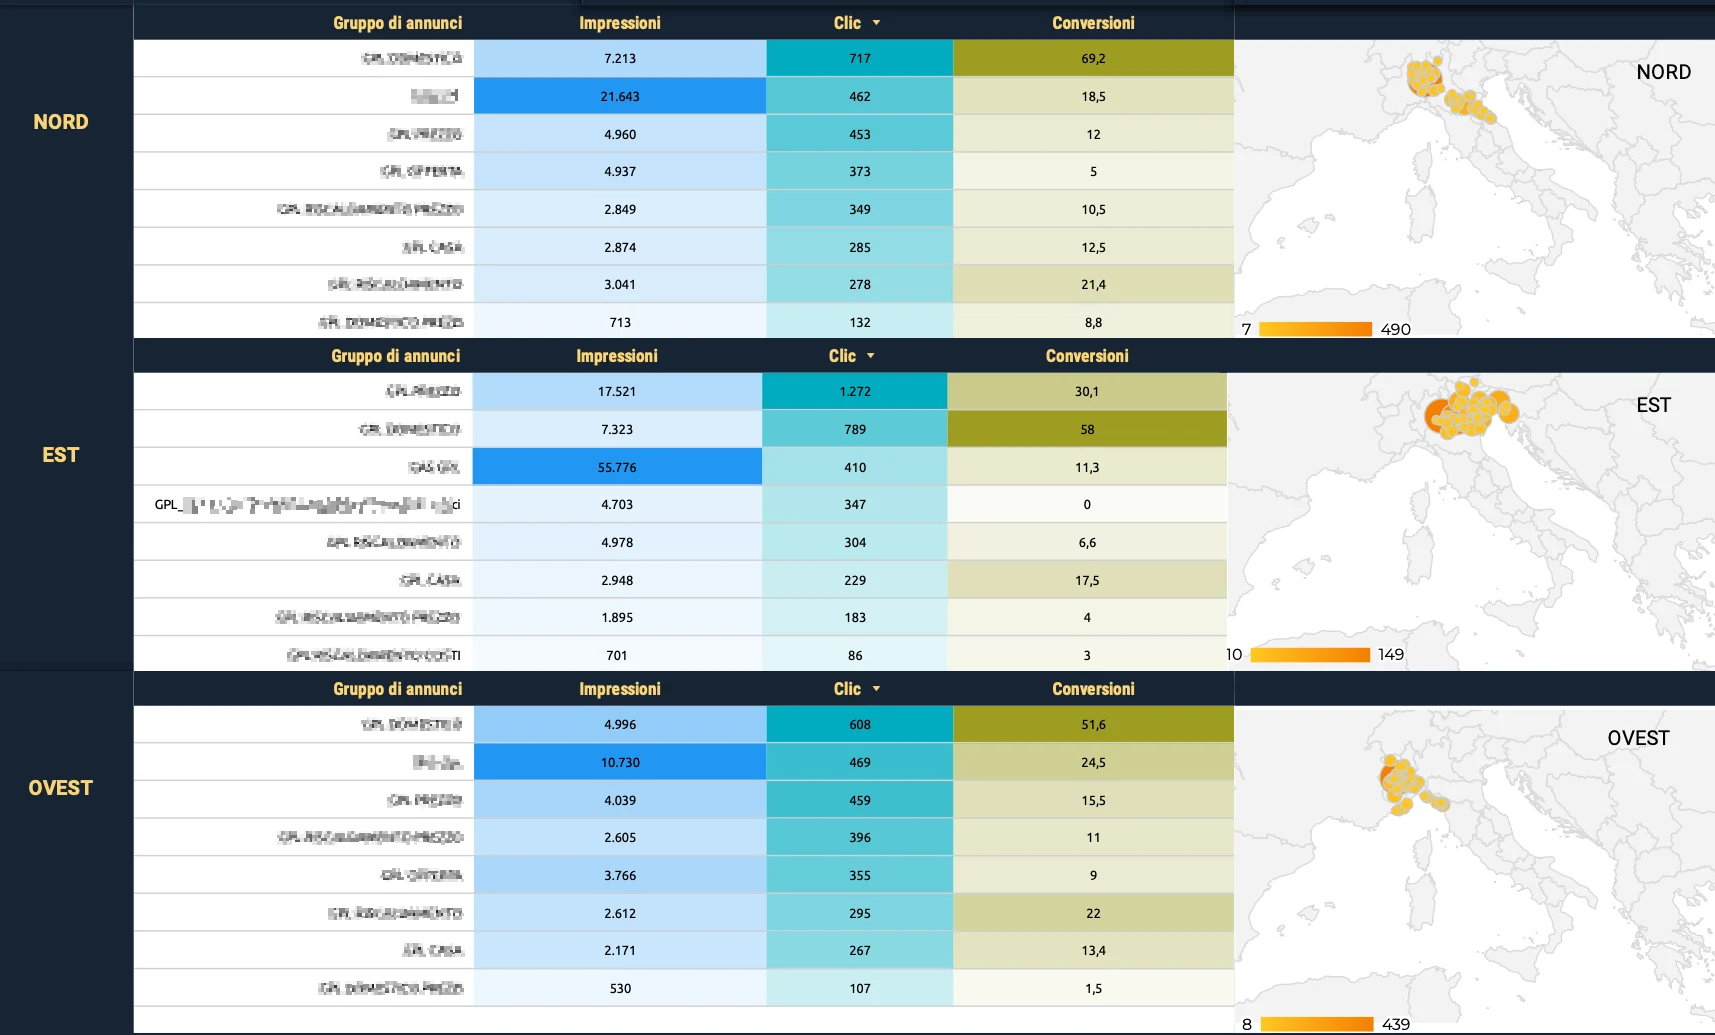
Regional tables and maps break down impressions, clicks, and attributed conversions across the North, East, and West areas. This structure helps the client explore territorial differences that would be hidden in an overall total, while keeping the same metrics available for each area.
Geographic Campaign Analysis: South and Centre
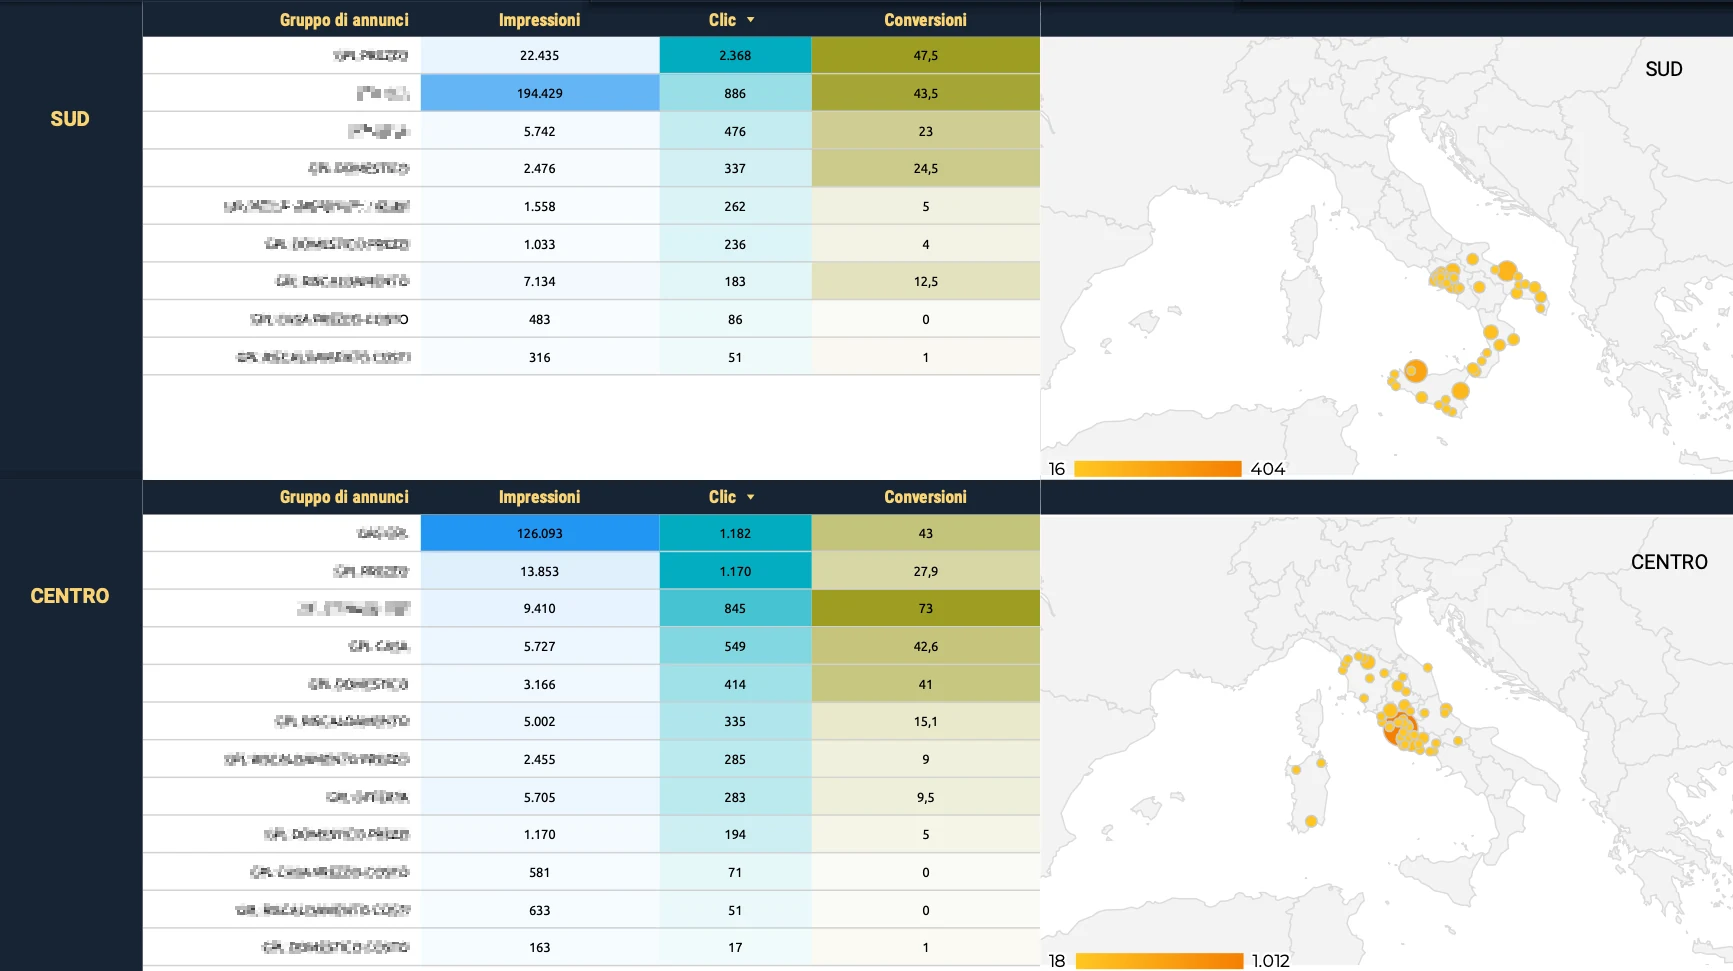
The South and Centre views extend the same geographic reporting framework. Ad-group tables sit alongside maps, making it easier to review campaign activity by territory. These views show the distribution of recorded results; campaign costs and lead quality would be needed to assess regional profitability.
Lead Tracking and Conversion Reporting
Contact Actions and Acquisition Channels
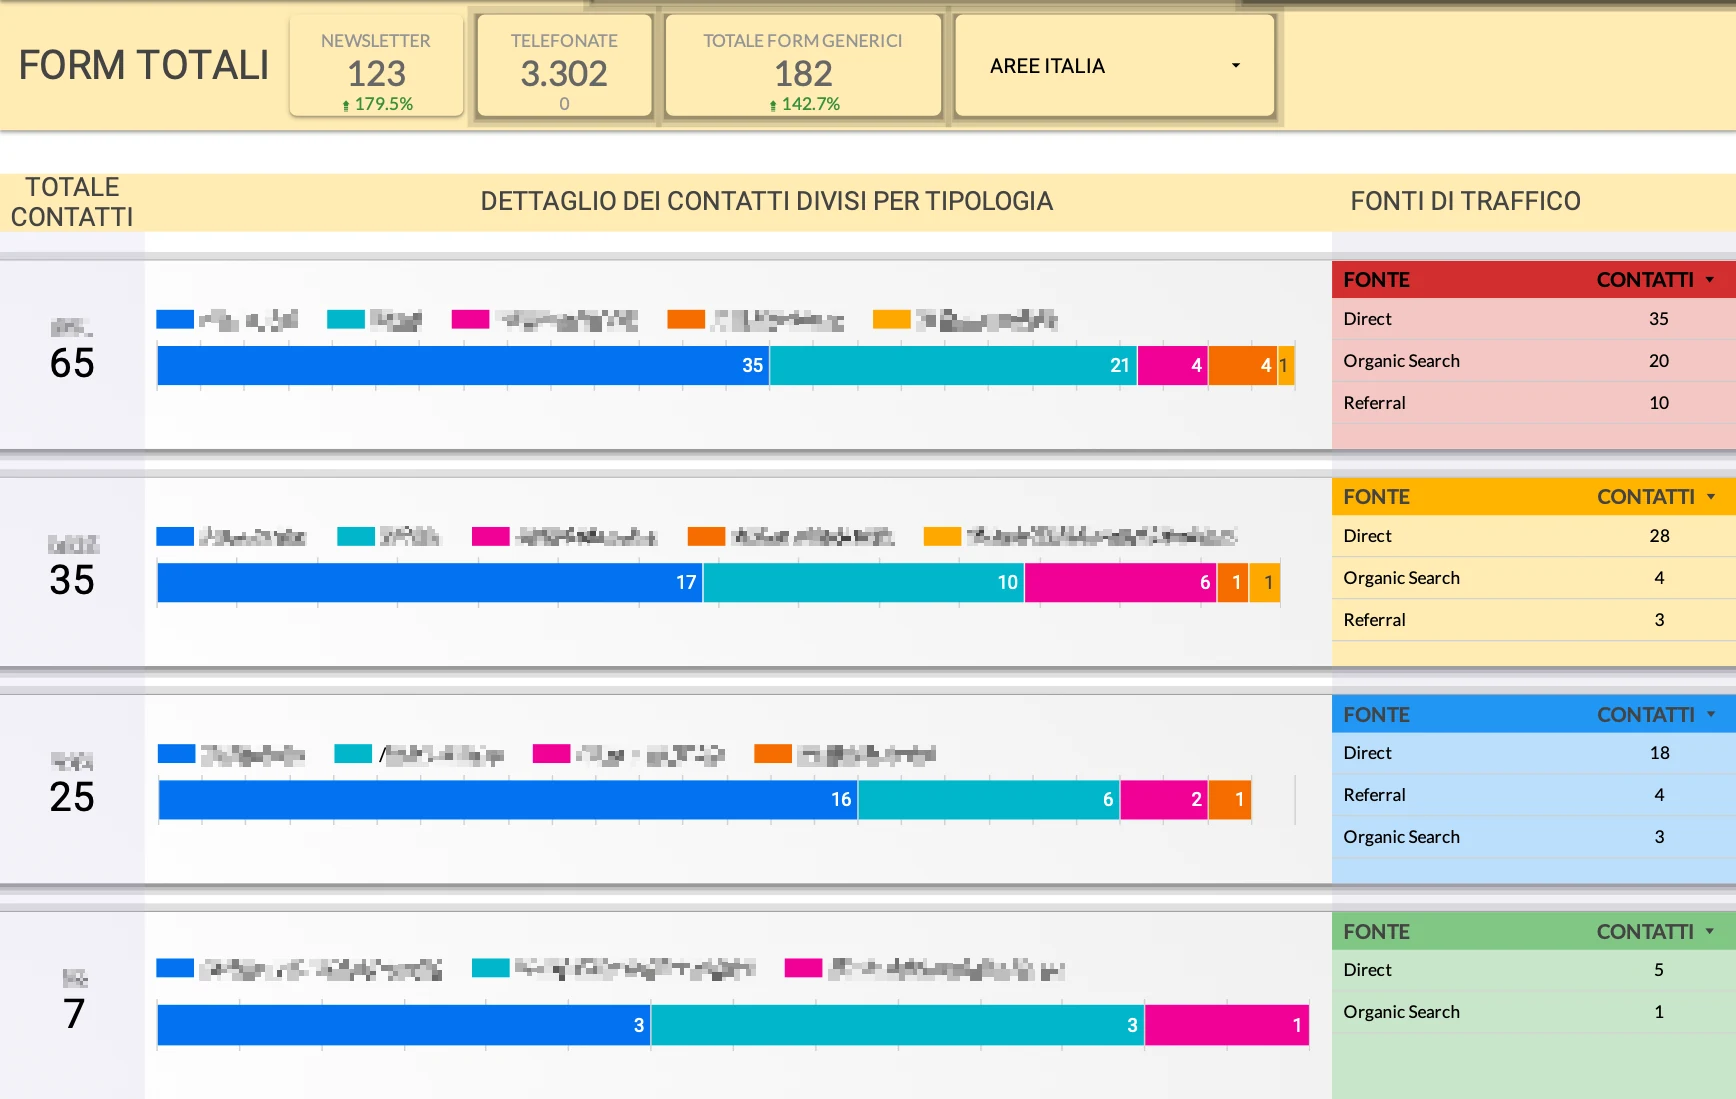
This section separates newsletter sign-ups, reported phone interactions, and generic form submissions. Category-level breakdowns show the composition of recorded contacts and their associated acquisition channels. The dashboard reports 123 newsletter sign-ups, 3,302 phone interactions, and 182 generic forms, keeping these action types distinct rather than presenting them as unique people.
Contact Requests by Customer Segment
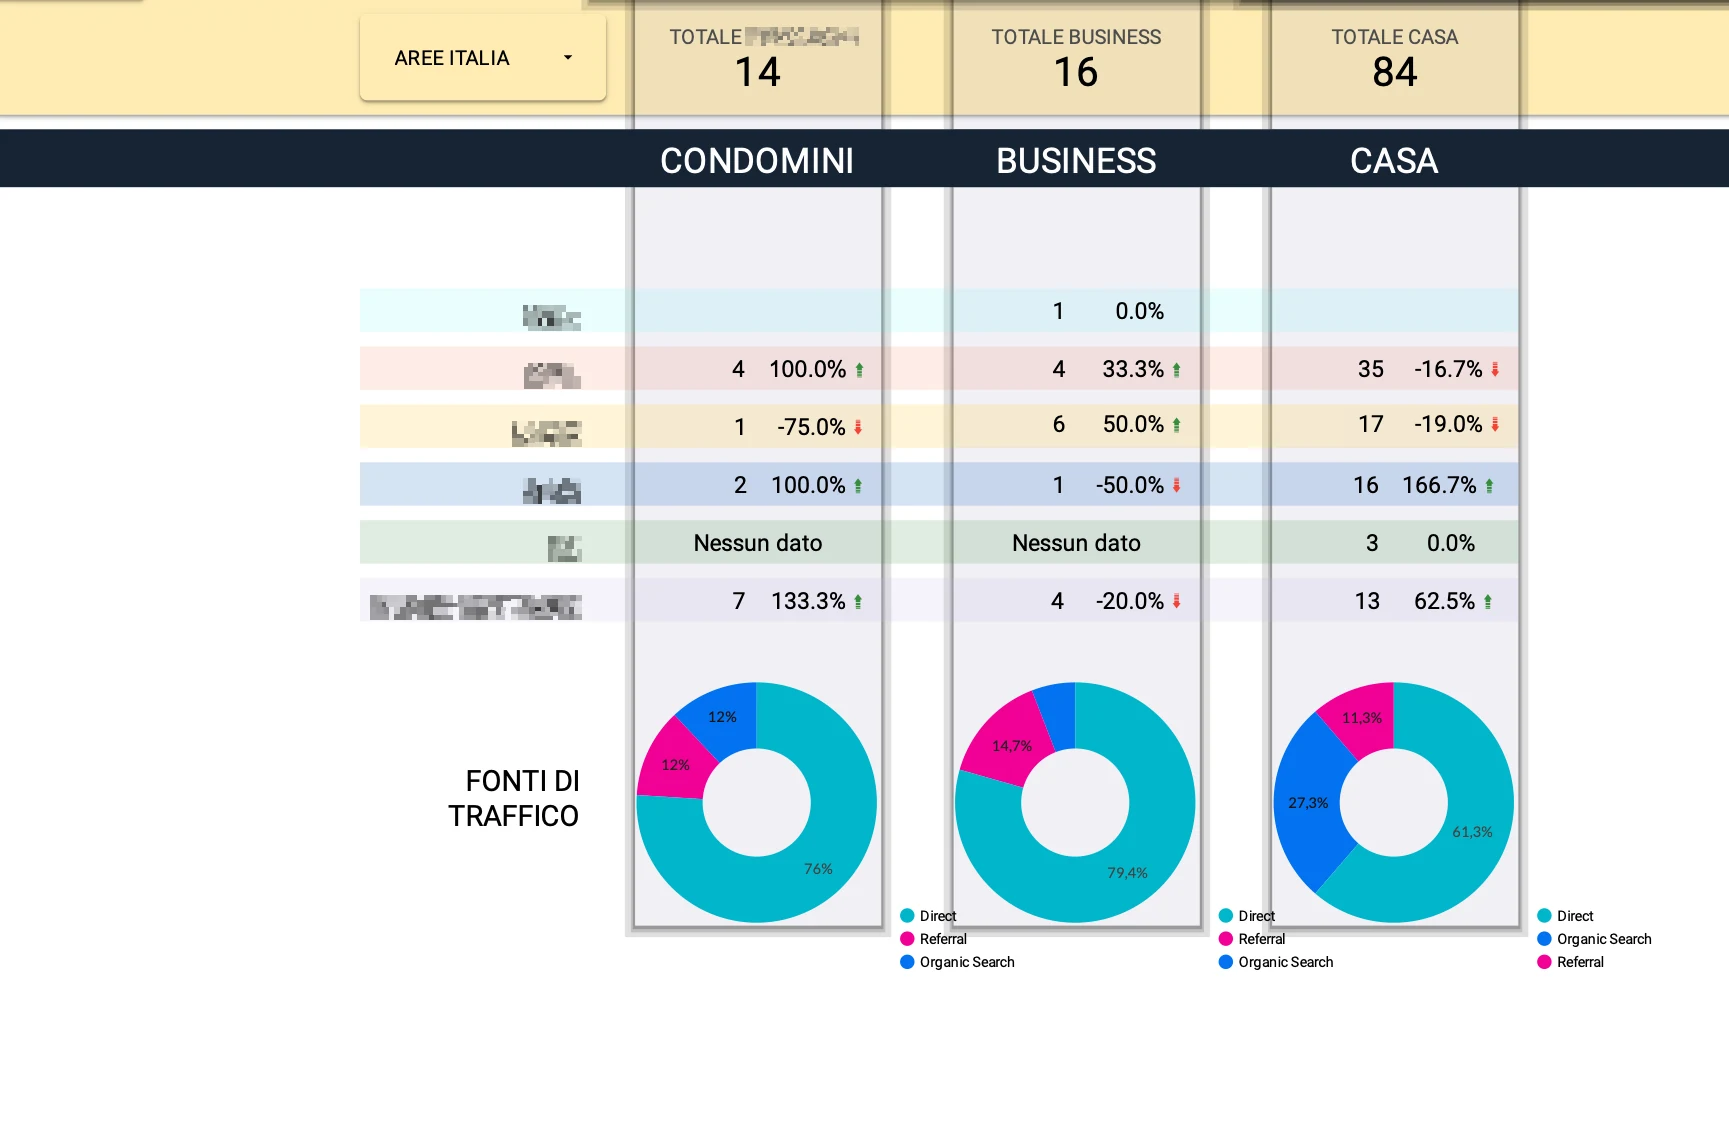
Contact requests are grouped into three commercial segments: condominiums, business, and home. Each segment includes totals, category comparisons, and a channel breakdown. This structure aligns the reporting with the client’s service offering, making it easier to explore which parts of the business receive recorded enquiries.
Geographic Lead Analysis
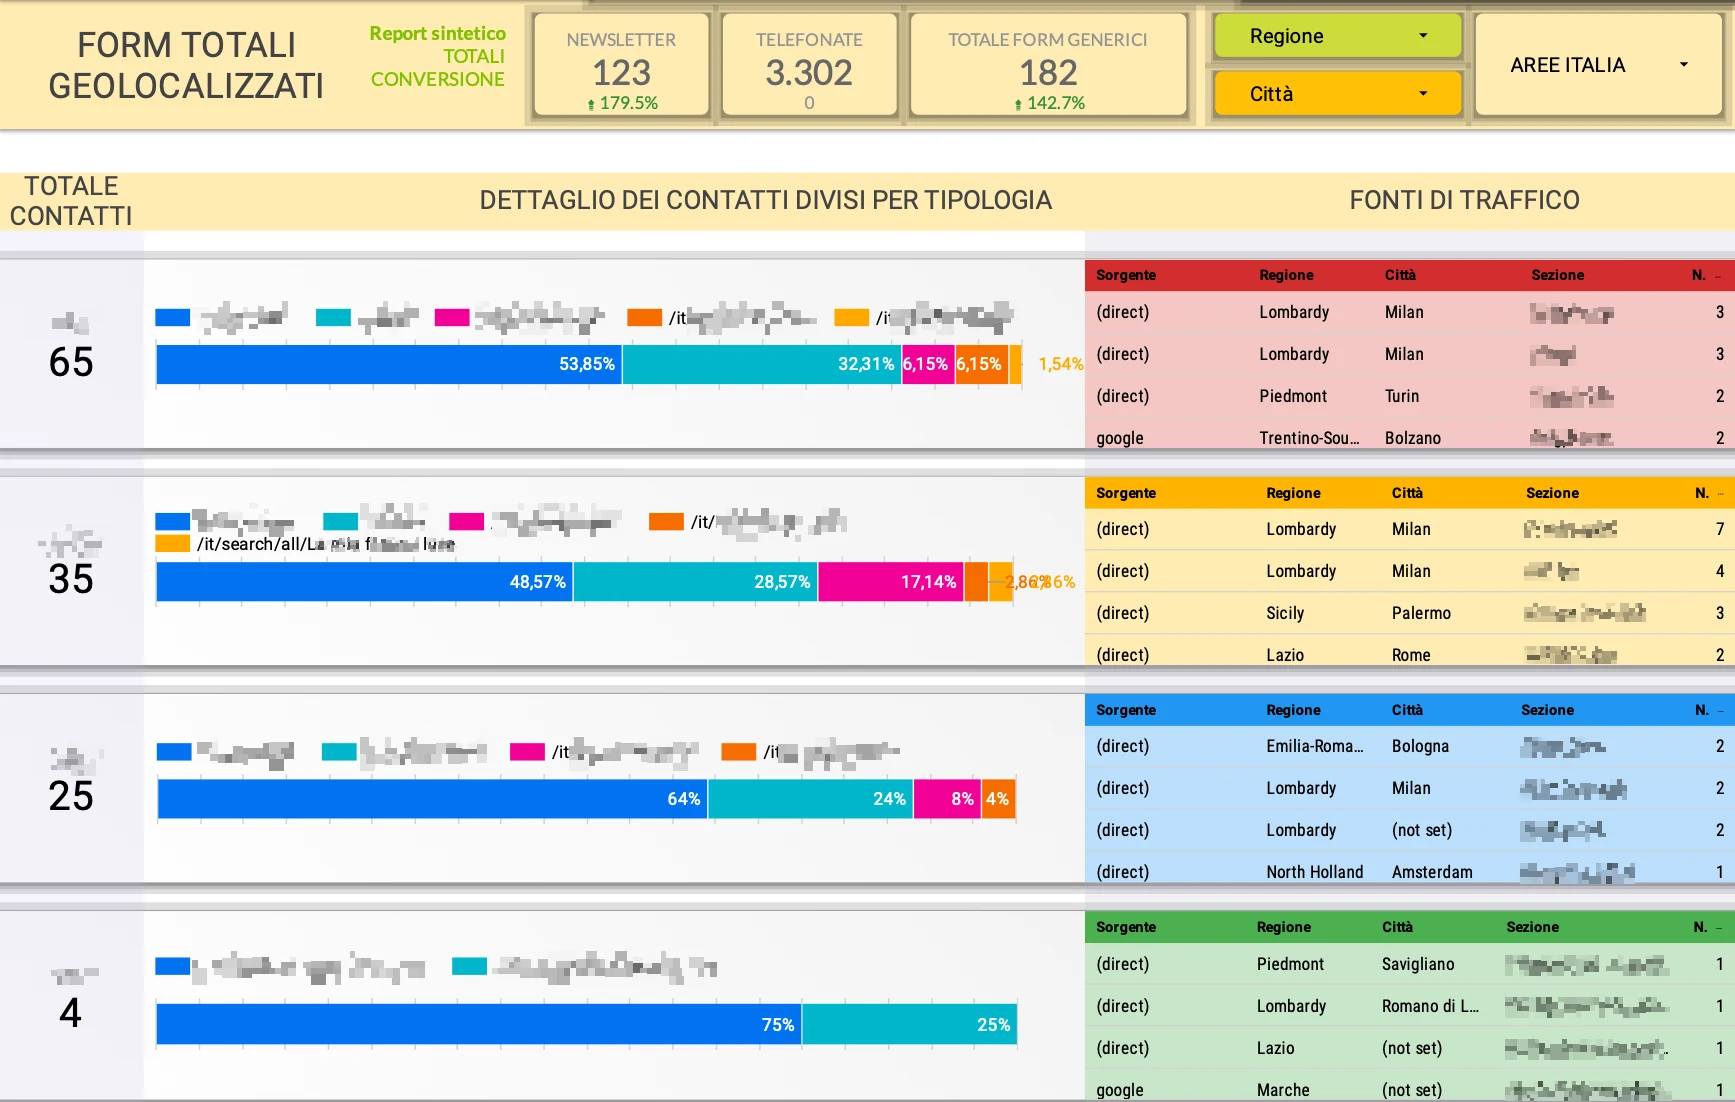
The geographic contact view adds source, region, city, and website section to the analysis. Filters allow the client to explore selected territories, while stacked bars show the relative contribution of different sections. This provides context around recorded requests without presenting analytics-derived locations as verified customer addresses.
Project Outcome
The project delivered a reporting environment that connects acquisition, website usage, campaign performance, and contact actions.
Its value lies in the ability to move from a high-level overview to focused analysis by channel, content, device, territory, and customer segment—giving the client a clearer structure for reviewing digital performance.