Product · 2026
Building an AI Visibility Monitoring Platform
SEO / GEO: The AI prompts visibility platform built with Node.js, Supabase, Redis and Docker, used in production for brand monitoring.

When someone asks an AI assistant to recommend a product, compare services, or suggest where to shop, which brands appear in the answer?
That was the question behind this project.
I built a SaaS platform to monitor how ChatGPT, Gemini, and Perplexity represent a brand alongside its competitors. Similar in purpose to tools such as Otterly.ai, it turns a collection of monitored questions into a structured view of brand presence, competitive positioning, and cited sources.
The software was used in production. This case study focuses on the product’s design, the workflow it supports, and the value it brought to the business.
Project overview
| Area | Details |
|---|---|
| Product | AI visibility and competitor monitoring SaaS |
| Focus | Brand mentions, cited sources, prompt monitoring, and competitive comparison |
| AI engines | ChatGPT, Gemini, and Perplexity |
| Technologies | Node.js, Supabase, Redis, Docker |
| Infrastructure | VPS |
| Deployment context | Used in production |
The problem: moving beyond isolated AI answers
Manually checking how an AI assistant talks about a brand is straightforward. Turning those checks into a useful company workflow is a different problem.
A single answer provides limited context. It does not show whether the brand appears consistently, how its presence compares with competitors, or whether a different engine gives a different picture.
It also leaves important distinctions unresolved. Being mentioned is not the same as being recommended prominently. Appearing in an answer is not the same as having a website cited as a source.
The platform was designed to bring those perspectives together without reducing them to a single score.
The goal was comparability: give the team a consistent way to investigate brand visibility across questions, engines, competitors, and time.
Designing the monitoring workflow
The product is organized around projects. Each project defines the brand being monitored, its website, and its target country and language.
Within that workspace, users manage competitors, organize prompts with tags, and explore the collected results through a dashboard and dedicated detail pages.
The workflow follows a simple progression:
- Define the brand and its competitive context.
- Select the customer questions to monitor.
- Organize those questions into meaningful topics.
- Review results across the supported AI engines.
- Investigate differences through mentions, citations, rankings, and trends.
This structure connects configuration with analysis: the questions and competitors selected at the start provide the context for everything shown later.
The dashboard: an overview with room to investigate
The dashboard brings together headline indicators, competitive comparisons, and trends.
Its design follows a “summary first, detail next” approach. Users can start with an overview, then narrow their investigation without immediately navigating through multiple reports.
Different metrics for different questions
The headline indicators separate several aspects of visibility:
- Brand mentions describe the volume of observed presence.
- Coverage describes how broadly a brand appears across the monitored questions.
- Average position helps assess how prominently it appears.
- Source-related metrics describe visibility through cited websites.
- Citation-gap reporting highlights differences between being mentioned and being supported by a link.
The purpose is not to make every metric move in the same direction. It is to show that visibility has several dimensions, each worth investigating separately.
Competitive views that complement each other
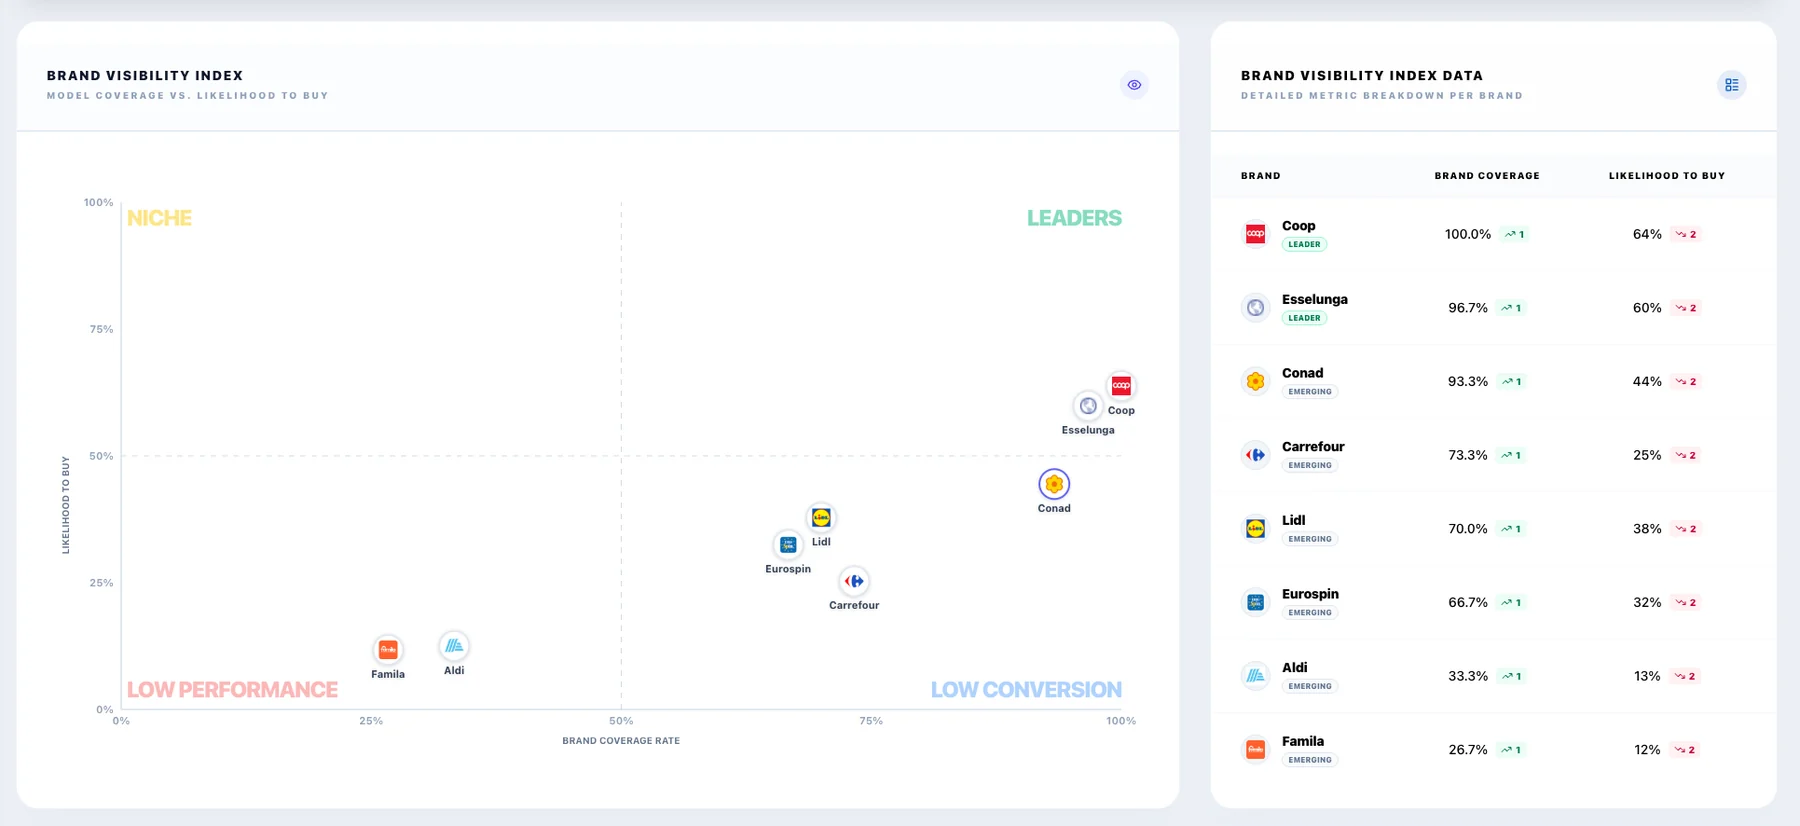
The dashboard combines a positioning chart with comparison tables and ranking distributions.
The chart provides a quick visual overview. The tables preserve the detail needed to compare individual dimensions, while ranking distributions help distinguish frequent appearances from prominent ones.
The visual positioning score is an analytical feature of the product, not a measurement of real customer purchase intent or sales conversion.
Filters that give the numbers context
On the overview, users can filter by AI engine, selected brands, prompt tags, and time period. These controls make it possible to investigate a narrower question within the same workspace.
For example, the team can focus on a particular topic or compare a subset of competitors rather than relying exclusively on overall averages.
Trends without losing the underlying context
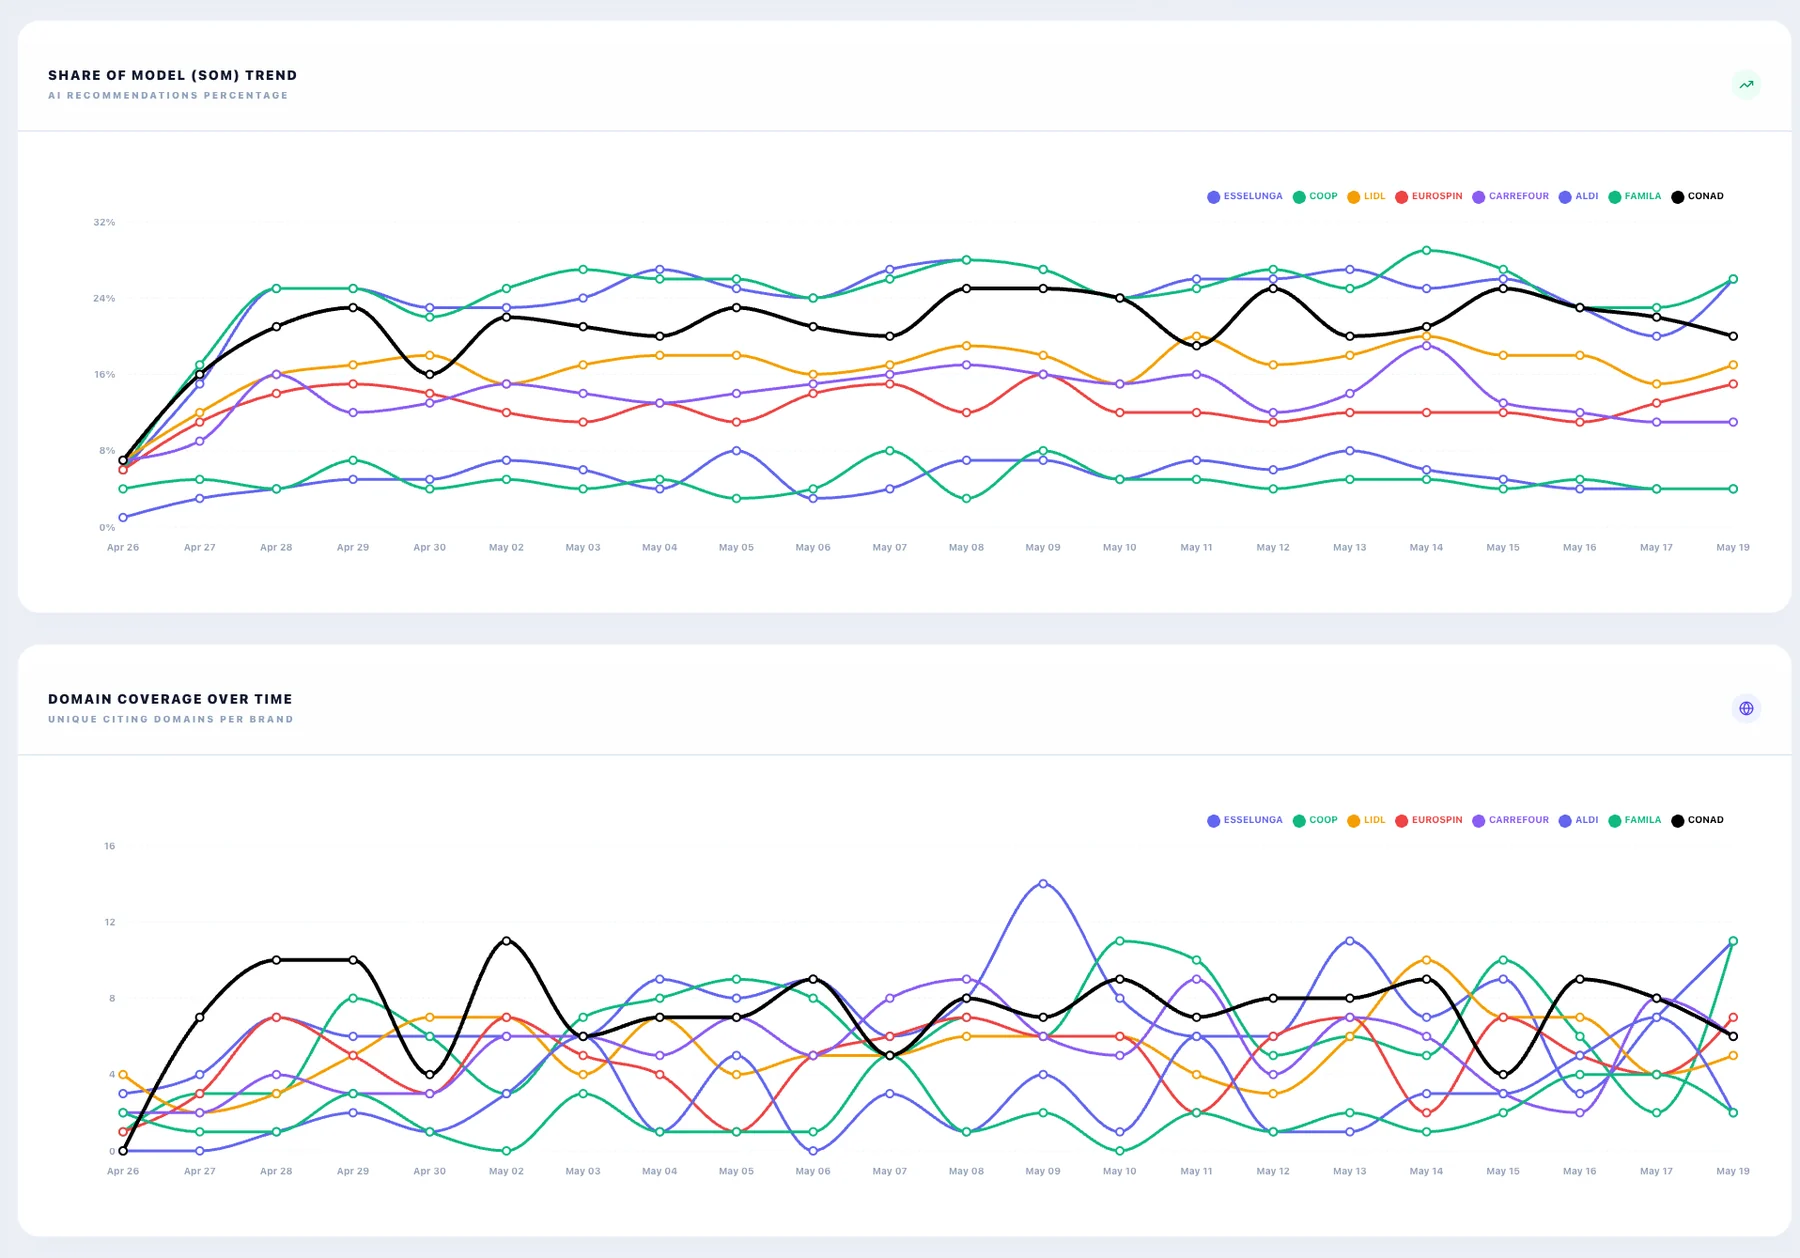
Time-series charts add a historical perspective to the competitive views.
They provide a place to review changes and investigate whether an apparent difference persists. They can also support analysis around content or communication initiatives, without implying that a change in the chart proves causation.
The detail pages: giving each task its own workspace
The dashboard provides breadth. The detail pages provide focus.
Each page centers on a different object—questions, brands, sources, tags, or competitors—so users can investigate without mixing configuration tasks and analytical questions.
Prompts: connecting visibility to customer questions
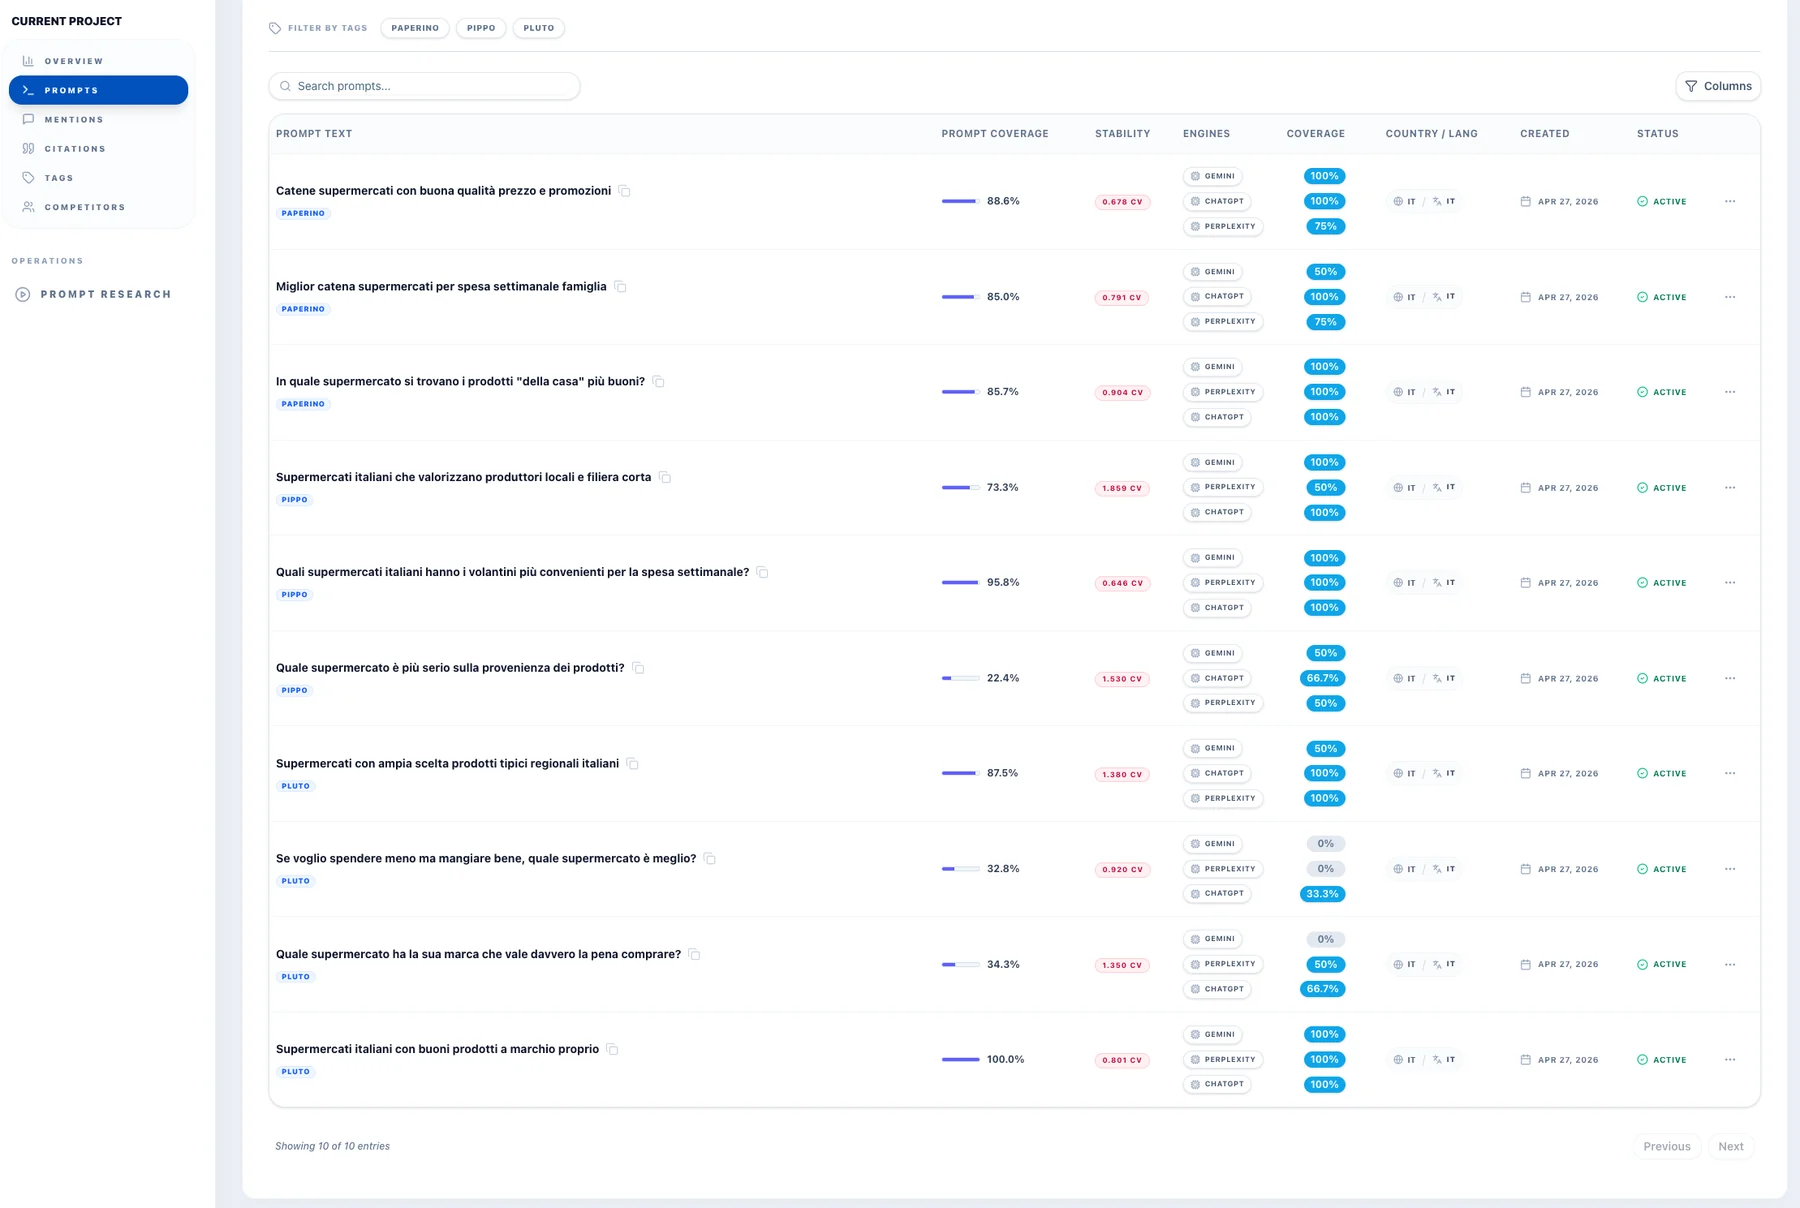
The Prompts page is the operational core of the product.
It lists the monitored questions alongside coverage indicators, a stability metric, engine-specific results, and configuration details such as tags, language, and status. Search and tag controls help users navigate the question set.
The most important design choice is showing the overall view alongside the engine breakdown. An aggregate result can be a useful starting point, but the breakdown makes differences between engines visible.
The stability indicator adds another layer of interpretation: users should consider variability as well as apparent performance.
Together, these elements help the team investigate which customer questions need attention, rather than treating visibility as a brand-wide average.
Brand Mentions: understanding presence beyond a total count
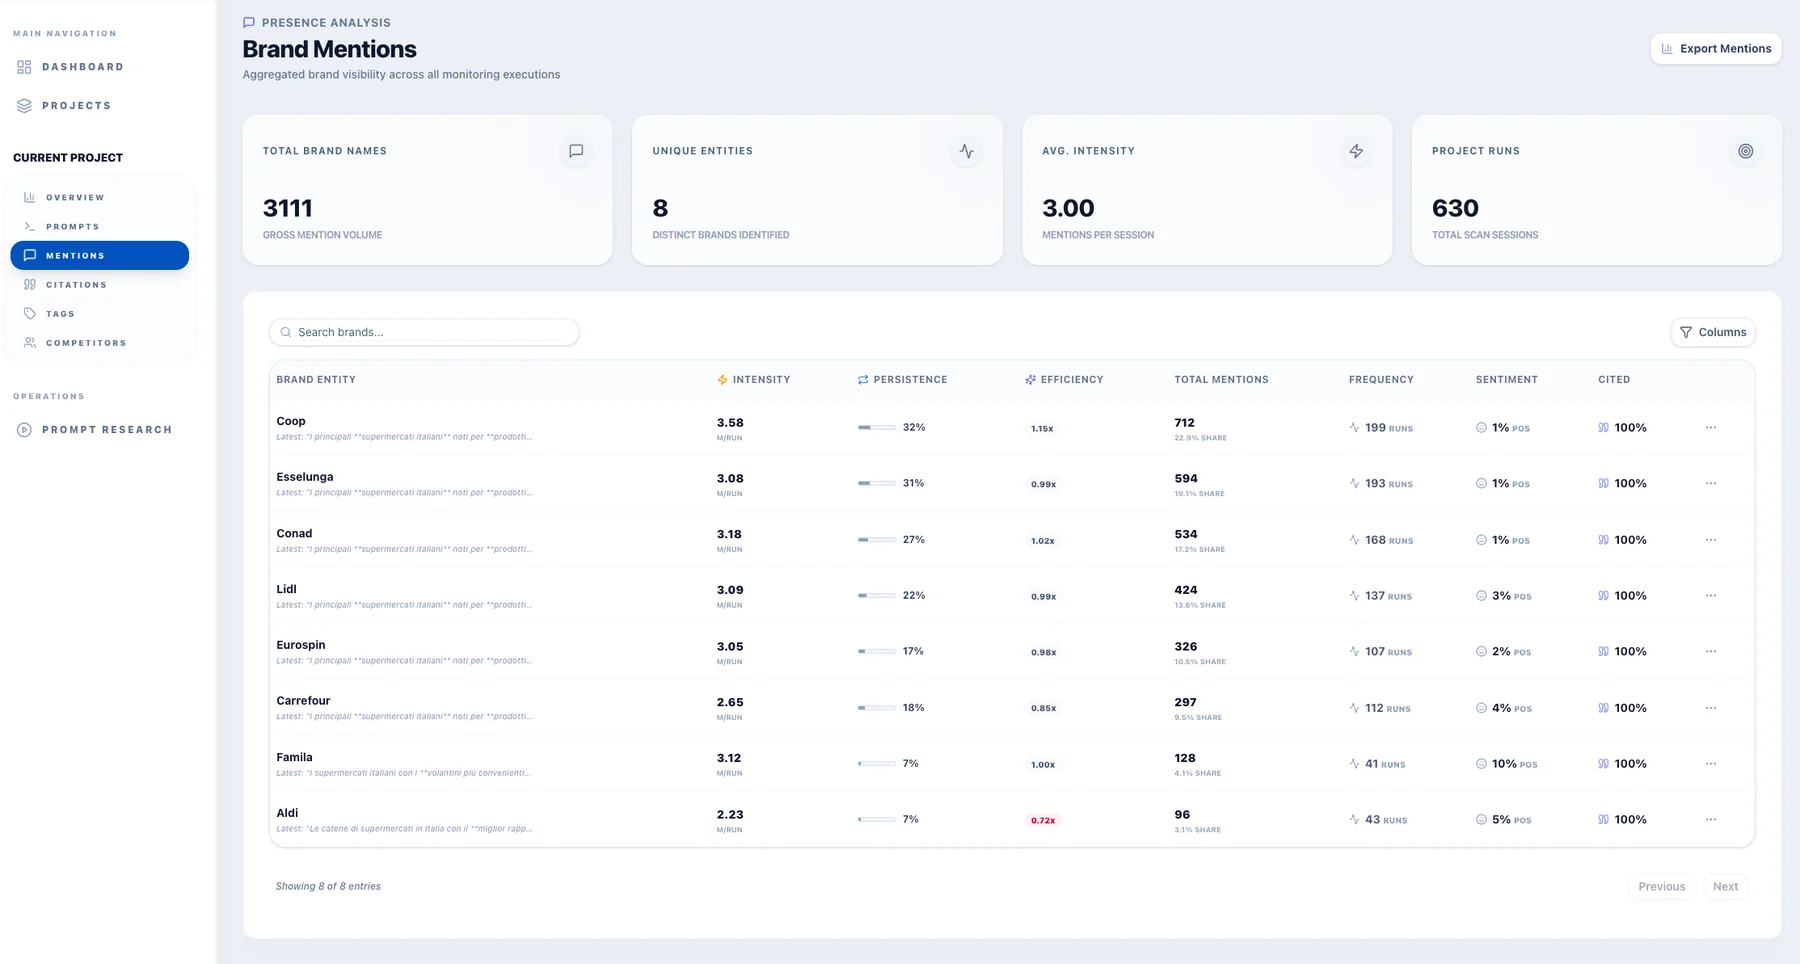
The Brand Mentions page reorganizes the results around the tracked brands.
It brings together mention volume, frequency, intensity, persistence, an efficiency indicator, sentiment, and citation-related information. A text excerpt adds context alongside the numerical summary.
The page’s purpose is to distinguish different patterns of presence. A brand appearing repeatedly within a small number of answers is not necessarily the same as one appearing across many monitoring sessions.
Separating these perspectives makes the report more informative than a leaderboard based only on total mentions.
The excerpt also creates a useful connection between measurement and language: users can see an example of how a brand was discussed, not just how often it appeared.
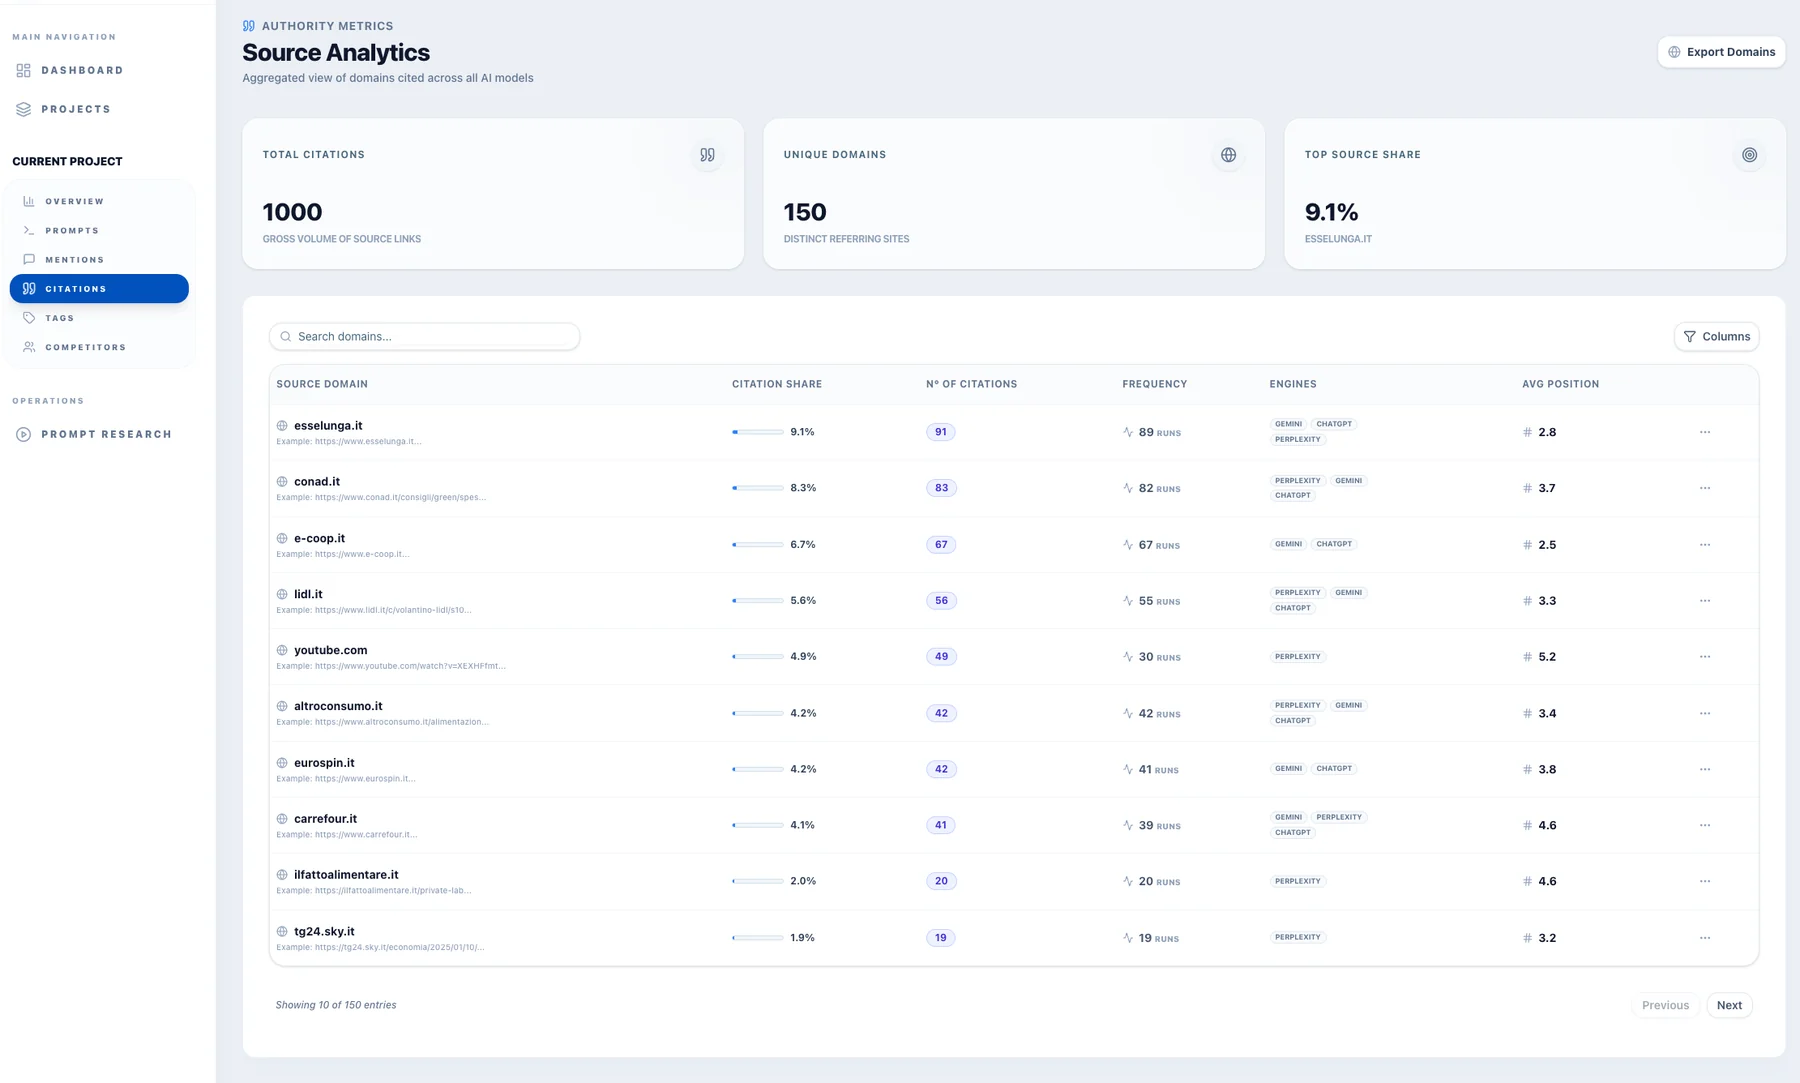
Citations: a separate view of the sources
The Citations page shifts the focus from brands to websites.
It aggregates cited domains and presents citation share, citation count, frequency, engine coverage, average position, and example URLs. Search and export controls support further investigation.
Keeping sources separate from mentions is an important product decision. A brand appearing in the answer and a website appearing in its citations are related observations, but they are not interchangeable.
This page gives content and SEO teams a practical starting point for examining which domains and pages appear in the monitored responses.
It can inform research into owned content and external publications without presenting citation frequency as proof of trust, endorsement, or a guaranteed route to improved visibility.
Tags: making topic-level analysis manageable
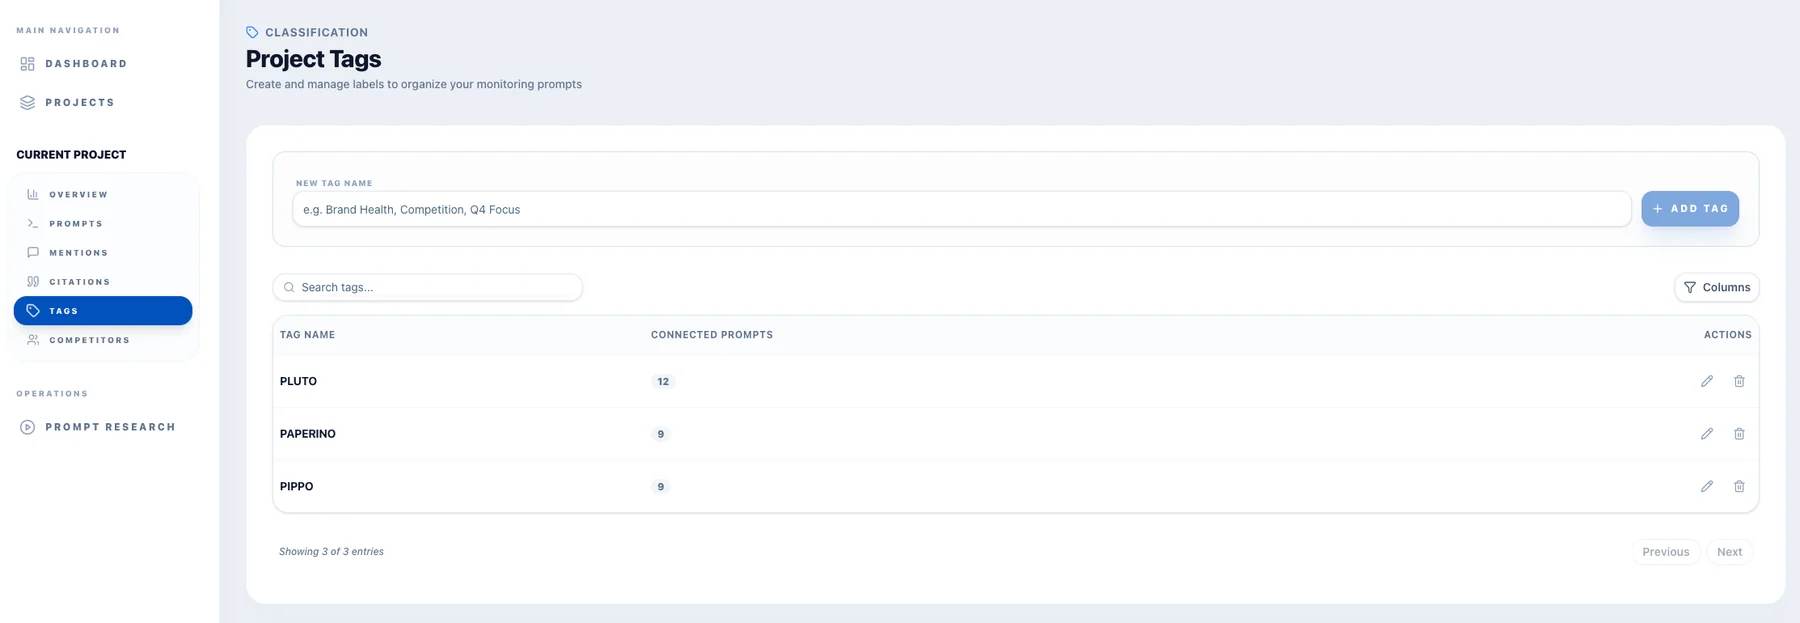
The Tags page provides a lightweight way to organize the prompt set.
Users can create labels, search existing tags, review their connected-prompt counts, and access editing or deletion controls.
Its value extends beyond housekeeping. Tags are also available in the dashboard filter, connecting the organization of questions with topic-level analysis.
This lets the same project support different views of the brand without requiring a separate project for every theme.
Competitors: making the benchmark explicit
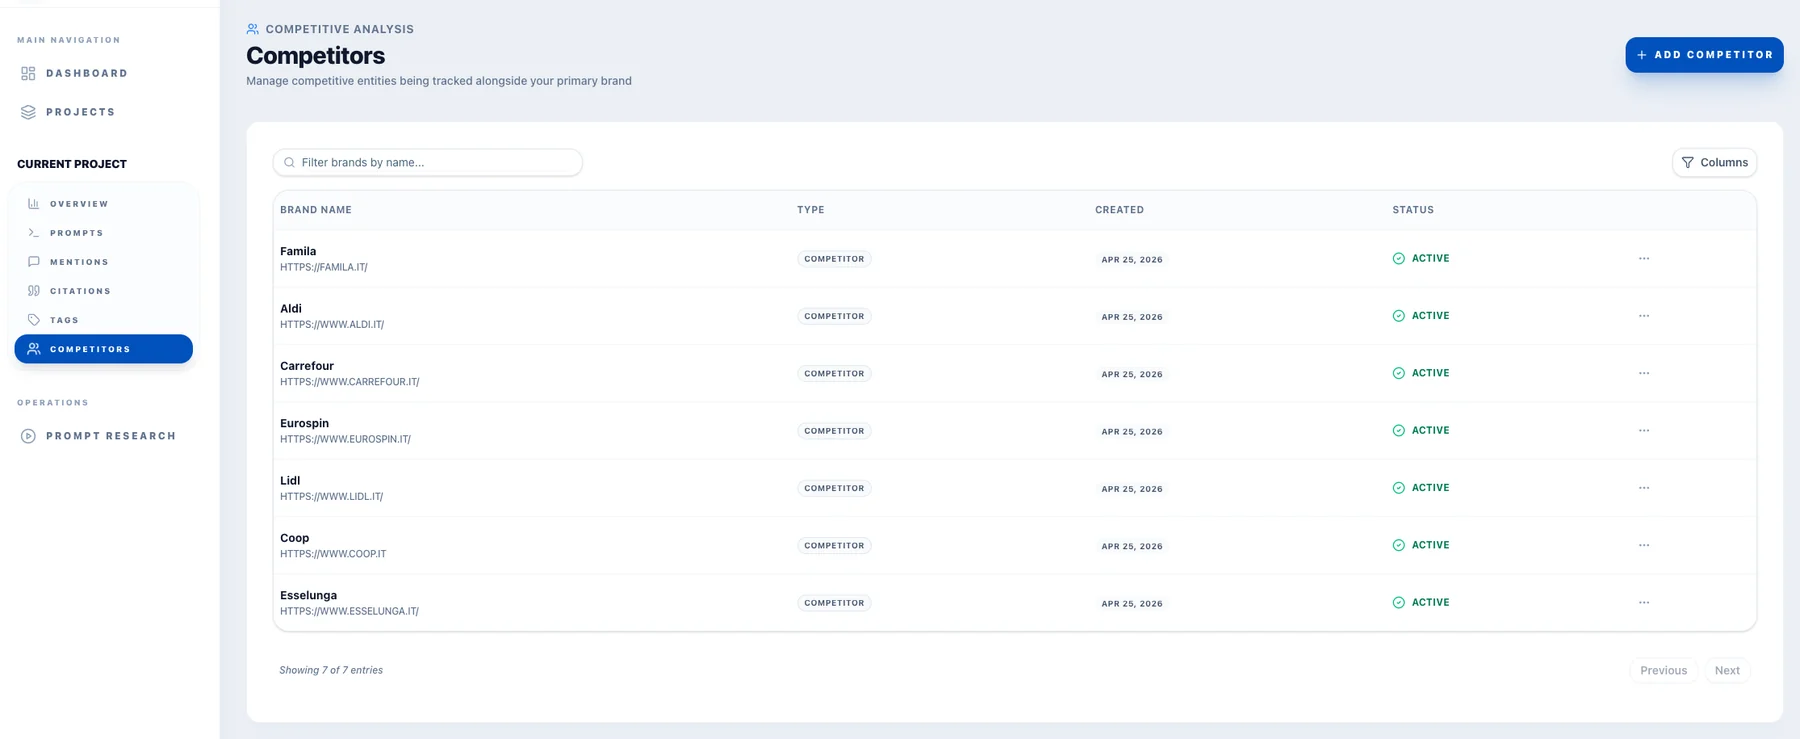
The Competitors page defines the brands tracked alongside the primary brand.
The table presents each competitor’s name, website, type, creation date, and status, with controls for adding entries and accessing row-level actions.
Giving this configuration its own workspace makes the competitive context visible and manageable. Users can see who belongs in the monitoring scope rather than treating the benchmark as an unexplained part of the report.
Technical challenges and product decisions
The challenge was not simply collecting answers. It was turning those answers into a product that people could use consistently.
Bringing different engines into one reporting structure
The interface needed a common structure for comparing results while preserving engine-specific differences.
The product addresses this through shared reporting views paired with engine breakdowns and filters. Users can move between an overall perspective and a narrower one without changing the basic language of the interface.
Making variability visible
A monitoring tool should not imply that every observed answer is a fixed result.
The product therefore includes both a stability indicator at prompt level and historical views in the dashboard. These give users ways to examine variation rather than hiding it behind a headline number.
Separating measurement concepts
Mentions, cited links, coverage, and position answer different questions.
The reporting structure keeps these concepts distinct while bringing them together where comparison is useful. Dedicated pages reduce ambiguity; shared dashboard views make the relationships easier to explore.
Balancing analytical depth with usability
The interface contains a substantial amount of information. Presenting it all at once would make the product difficult to navigate.
The solution is a layered structure: headline cards for orientation, charts for patterns, tables for comparison, and dedicated pages for focused work.
Technology and deployment
The platform uses Node.js, Supabase, and Redis, with Docker containers deployed on a VPS.
This stack supported the production application. Containerized deployment also provided a consistent packaging approach for running its services.
The technical foundation served a practical goal: deliver an operational monitoring product, not just a collection of scripts or a one-off reporting exercise.
Business value: bringing AI visibility into the workflow
The platform gave the company a shared workspace for investigating how AI engines represented brands and competitors.
Its contribution was not a promise of higher rankings or guaranteed commercial results. It was a more structured way to collect, review, and discuss a new category of visibility data.
A repeatable alternative to manual checks
The product brought monitoring into a centralized workflow, reducing reliance on scattered screenshots and isolated observations.
Questions, competitors, and analytical views could be reviewed within the same project context.
More specific conversations about content priorities
Prompt-level reporting and topic filters gave the team a way to investigate visibility around particular customer needs.
Instead of asking only whether a brand was visible, the team could ask where it appeared, on which engine, and in response to which questions.
A clearer competitive perspective
The combination of coverage, position, mentions, and citations supported more precise comparisons.
A discussion could move beyond “this competitor appears more often” toward an examination of the topics, engines, and types of presence behind that difference.
Reporting for different levels of detail
The dashboard supported a quick overview, while the detail pages provided a route into the underlying questions, brands, and sources.
That made the product useful as both a reporting interface and an investigative workspace.
Used in production, the platform brought AI visibility into a structured internal process—giving the business a practical way to monitor brand presence, examine competitive differences, and incorporate those observations into its SEO and content discussions.
Achievements
- Shipped a production-used SaaS platform for AI visibility and competitor monitoring.
- Brought ChatGPT, Gemini, and Perplexity into one shared reporting structure.
- Kept mentions, citations, coverage, and average position as separate, comparable dimensions.
- Added prompt-level stability indicators and historical trends so variability remained visible.
- Gave prompts, brand mentions, citations, tags, and competitors dedicated workspaces.
- Packaged the application with Docker for deployment on a VPS.